Prerequisites: Docker
Kubernetes is an open-source container management/orchestration tool designed to automate the deployment, scaling, and management of containerized applications. It was originally developed by Google and is now maintained by the Cloud Native Computing Foundation (CNCF).
Contents
- Features of Kubernetes
- Components of Kubernetes
- Minikube
- Kubernetes Objects
- Kubernetes Manifest YAML file
- Multi container pod environment
- Pod with ports
- Command and Arguments
- Labels and Selectors
- Node Selectors
- Node Affinity
- Pod Affinity and Pod Anti-Affinity
- Kubernetes Events
- Field Selectors
- ReplicaSets and Deployments
- Kubernetes Deployment Strategies
- Kubernetes Networking
- Services
- Ingress
- Cloud Controller Manager
- Init Containers
- Sidecar Containers
- Ambassador Containers
- Adapter containers
- Static Pods
- Volumes
- Volume Expansion
- LivenessProbe
- Readiness probes
- Startup Probe
- ConfigMap and Secrets
- Namespaces
- DaemonSet
- Resource Quota
- Horizontal Pod Autoscaling
- Jobs & CronJobs
- Kubernetes Pod LifeCycle
- Taints and Tolerations
- Network Policies
- Service Accounts
- Security Contexts
- Helm
- Kubernetes Best Practices
- Troubleshooting Kubernetes
- Draining Worker Nodes
- Taint Based Evictions
- Version Skew Policy
Features of Kubernetes
- Container Orchestration
- Load Balancing
- Auto Scaling
- Self-Healing
- Rolling Updates and Rollbacks
- Storage Orchestration
- Configuration and Secret Management
- Batch execution
- Platform Independent
- Fault Tolerance
| Kubernetes | Docker Swarm |
|---|---|
| Highly scalable with support for thousands of nodes and containers | Limited scalability compared to Kubernetes |
| More complex to set up and manage | Simpler to set up and manage |
| Provides built-in high availability features and offers advanced networking capabilities | Offers basic high availability capabilities and basic networking features |
| Kubernetes has built-in monitoring and supports integration with third-party monitoring tools. | Docker Swarm supports monitoring only through third-party applications. There are no in-built monitoring mechanisms. |
| Work with almost all containers like Docker, ContainerD | Work with docker only |
| Large and active community support | Smaller community compared to Kubernetes |
Components of Kubernetes
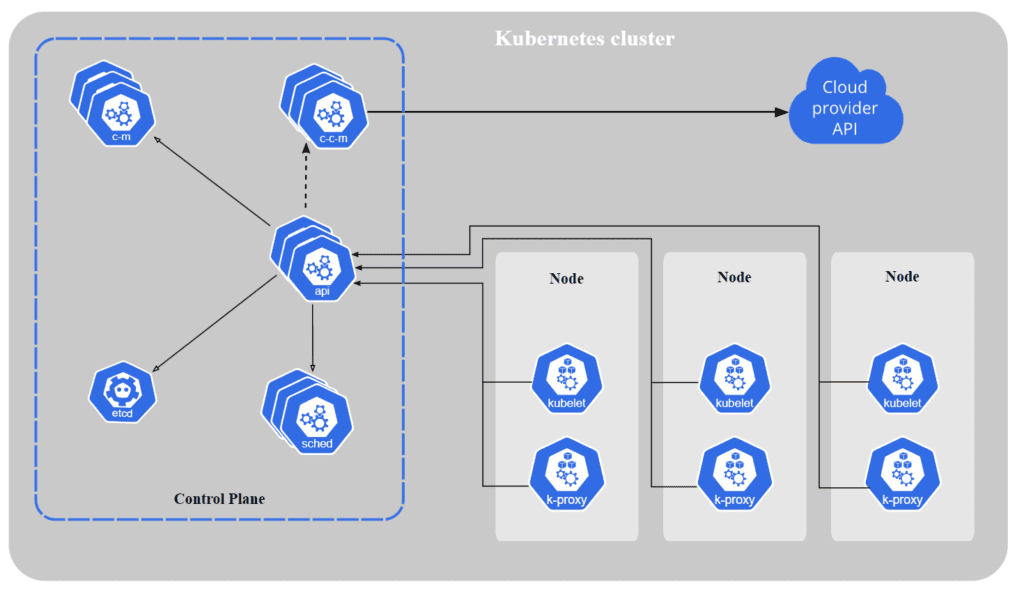
Master Components: The master components are responsible for managing the overall state of the Kubernetes cluster. They include:
- API server: This component exposes the Kubernetes API, which is used by other components to interact with the cluster. It is used to authenticate the user, validate requests, retrieve data, update etcd.
- etcd: This is a distributed key-value store used to store the configuration data for the cluster. It stores meta data and status of cluster.
- Controller manager: This component manages the state of the cluster. It makes sure actual state of clusters matches to desired state
- Scheduler: This component schedules the placement of containers on the available nodes in the cluster. It handles pod creation and management. For every pod that scheduler discovers, the scheduler becomes responsible for finding the best node for that pod to run.
Worker Components: These components run on every node in the Kubernetes cluster and are responsible for managing the containers that run on that node. They include:
- Kubelet: This component is responsible for communicating with the API server and managing the containers on the node. It sends success/fail reports to master
- kube-proxy: This component is responsible for routing network traffic to the appropriate container. It is required to assign IP addresses to pods (dynamic). Kube-proxy runs on each node and make sure that each pod will get its own unique IP address.
- Container runtime: This is the software that runs the container, such as Docker. Responsible for pulling images, start/stop containers, exposing containers on ports specified in manifest
- pods: A Pod is the smallest deployable unit in Kubernetes. It consists of one or more tightly coupled containers that share the same network and storage resources, and run in a shared context. One pod usually contains one container. Containers within a Pod share an IP address and port space and can find each other via the localhost.

Cluster: A cluster is a group of nodes. A cluster has atleast one worker node and master node
Fact: In a Linux environment, all the configurations are stored in the /etc directory and etcd is inspired from that and there is an addition of etcd which is for distributed.
Flow:
- kubectl writes to the API server (kubectl run mywebserver –image=nginx)
- API server will authenticate and authorize. Upon validation, it will write it to etcd.
- Upon write to etcd, API Server will invoke the scheduler.
- Scheduler decides on which node the pod should run and return data to API server. API will in-turn write it back to etcd.
- API Server will invoke the kubelet in the worker node decided by the scheduler.
- Kubelet communicates to the docker daemon via Docker socket to create the container.
- Kubelet will update the status of the POD back to the API server.
- API Server will write the status details back to etcd.
Minikube
Note: For beginners, Minikube is an excellent tool who have no prior experience in deploying multiple containers. It allows you to run a local single-node cluster, making it a great starting point to learn the fundamentals before diving into Kubernetes.
For Minikube installation: Click here
To start your cluster
minikube startminikube dashboardThe command “minikube dashboard” launches the web-based Kubernetes dashboard for Minikube. The dashboard allows you to view and manage various Kubernetes resources, such as pods, services, deployments, and more, in a convenient and intuitive way.
To pause Kubernetes without impacting deployed applications
minikube pauseTo unpause a paused instance
minikube unpauseTo halt the cluster
minikube stopTo delete your local cluster
minikube deleteTo get minikube status
minikube status
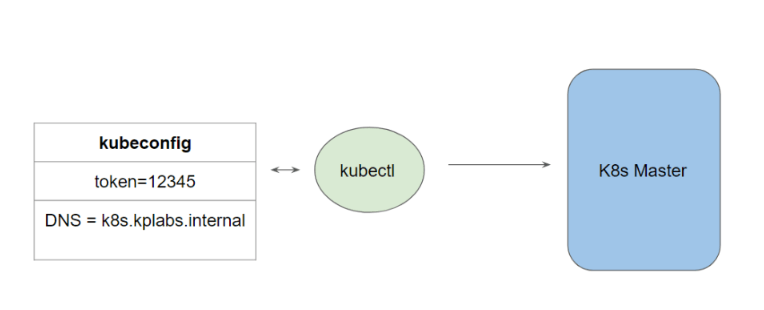
kubectl – kubectl is a command-line tool used for interacting with Kubernetes clusters. It enables users to manage and control Kubernetes resources such as pods, services, deployments, and more.
To connect to the Kubernetes Master, there are two important data which kubectl needs:
- DNS / IP of the Cluster
- Authentication Credentials
To display a list of pods
kubectl get podsTo view a list of all the nodes in the cluster along with details such as their names, status, roles, and other relevant information.
kubectl get nodes
To display the available API resources on a Kubernetes cluster
kubectl api-resources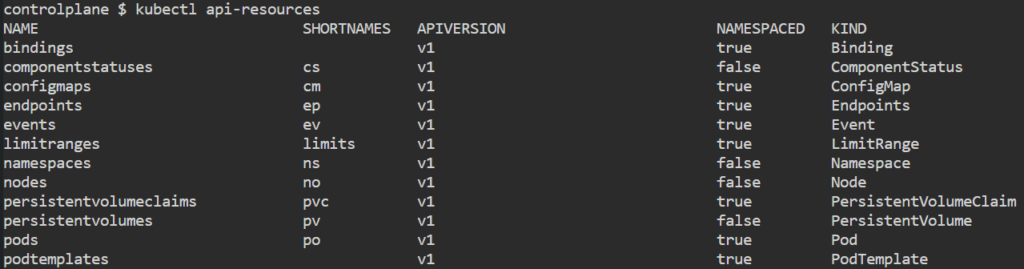
Online Playgrounds’ (Killercoda) : Click here
Kubernetes Objects
Objects are the fundamental building blocks used to deploy and manage applications within a cluster. These objects define the desired state of the system and are stored in the Kubernetes API server. Kubernetes continuously monitors the actual state of these objects and works to ensure that the current state matches the desired state.
Some common Kubernetes objects include:
- Pod
- Services
- Volume
- Namespace
- ReplicaSets
- Secrets
- ConfigMaps
- Jobs
- Deployments
Relationship between objects
- Deployments manage the lifecycle of pods.
- Pod manages containers.
- Replicaset manages pods.
- ConfigMaps are used to inject configuration data into pods.
- Secrets store sensitive information, such as passwords or API tokens.
- Services provide a stable network endpoint to access a group of pods. It exposes pod processes to the outside world.
These relationships demonstrate how different objects work together to create a functional and manageable application environment in Kubernetes.
There are various ways in which we can configure a Kubernetes Object:
- The first approach is through the kubectl commands.
- The second approach is through a configuration file written in YAML.
Kubernetes Manifest YAML file
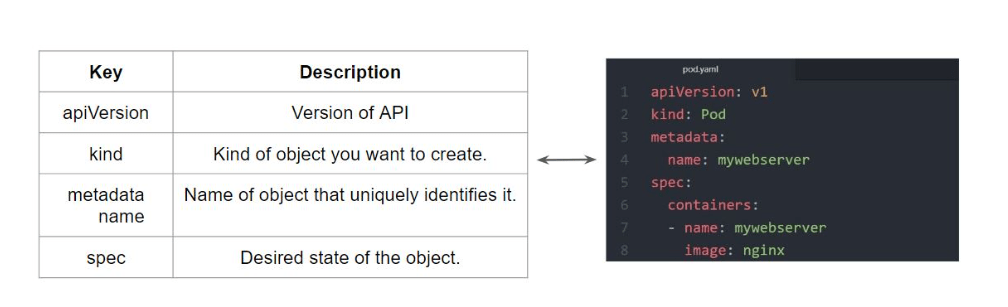
vim demo.ymlapiVersion: v1
kind: Pod
metadata:
name: testpod
annotations:
description: Hello world
spec:
containers:
- name: c00
image: ubuntu
command: ["/bin/bash", "-c", "while true; do echo Hello-satyam; sleep 5 ; done"]To create pod
kubectl apply -f demo.yml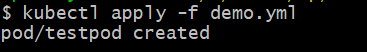
To display a list of pods running in the Minikube cluster
kubectl get pods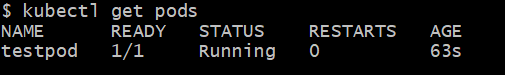
If you want to see where exactly pod is running including the node name and IP address.
kubectl get pods -o wide
To stream the logs of a specific pod in real-time
kubectl logs -f testpod 
To delete a pod
kubectl delete pod testpod To delete a pod by deleting a YAML file
kubectl delete -f demo.yml Imperative approach to create pods
kubectl run nginx --image=nginx --port=80 --restart=Never --dry-run=client -o yaml > pod.ymlTo perform live modifications to a running Kubernetes object
kubectl edit <resource_type> <resource_name>
Note: You can’t modify everything within the live object (Ex. Liveness and Readiness Probe)
Note: This method is convenient for quick edits, but it might not be suitable for automation and controlled changes.
kubectl patch deployment my-deployment -p '{"spec":{"replicas":3}}'
The patch method is more suitable for automation and scripting. It’s often used in CI/CD pipelines or scripts.
Multi container pod environment
vim demo2.ymlapiVersion: v1
kind: Pod
metadata:
name: testpod2
spec:
containers:
- name: c00
image: ubuntu
command: ["/bin/bash", "-c", "while true; do echo satyam-arya; sleep 5 ; done"]
- name: c01
image: ubuntu
command: ["/bin/bash"]
args: ["-c", "while true; do echo aman-sharma; sleep 5 ; done"]
kubectl logs -f testpod2 -c c00Pod with ports
vim demo4.ymlapiVersion: v1
kind: Pod
metadata:
name: testpod4
spec:
containers:
- name: c00
image: httpd
ports:
- containerPort: 80 kubectl get pods -o wideCopy the IP
curl <IP>:80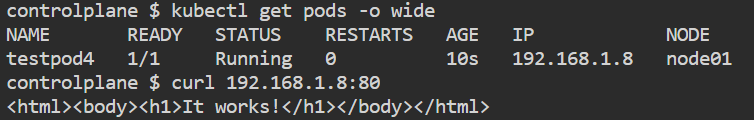
We can also associate a name associated with the port. This name must be unique within the pod.
apiVersion: v1
kind: Pod
metadata:
name: testpod4
labels:
app: named-port-pod
spec:
containers:
- name: c00
image: httpd
ports:
- containerPort: 80
name: http
---
apiVersion: v1
kind: Service
metadata:
name: named-port-svc
spec:
ports:
- port: 80
targetPort: http
selector:
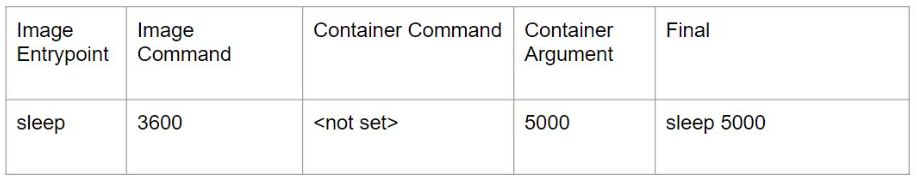
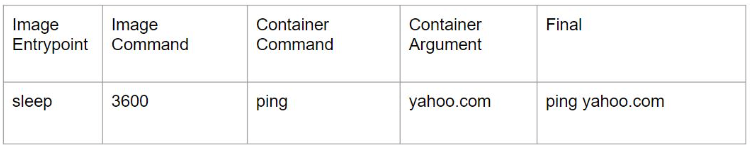
app: named-port-podCommand and Arguments
In Kubernetes, we can override the default ENTRYPOINT and CMD with command and args field.

Case 1:
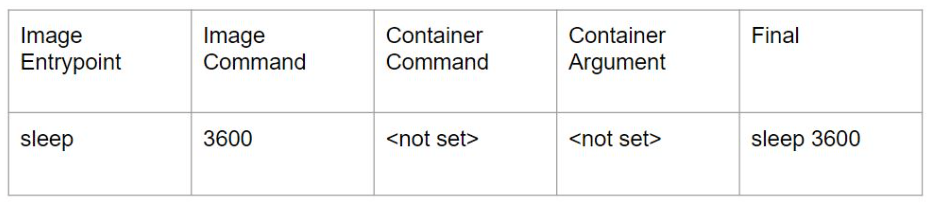
Case 2:

Case 3:
Case 4:
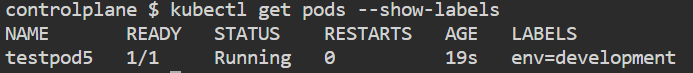
Labels and Selectors
- Labels are used to attach metadata to Kubernetes objects, such as pods, services, and deployments.
- Labels are similar to tags in AWS
- Selectors are used to query and select resources based on their labels. They enable you to perform operations on a group of resources that share a common set of labels.
apiVersion: v1
kind: Pod
metadata:
  name: testpod5
  labels:
    env: development
spec:
    containers:
       - name: c00
         image: ubuntu
         command: ["/bin/bash", "-c", "while true; do echo Hello; sleep 5 ; done"]
kubectl get pods --show-labelsUsed to retrieve information about pods in a Kubernetes cluster, including their labels.
If you want to add label to an existing pod
kubectl label pods testpod5 myname=satyam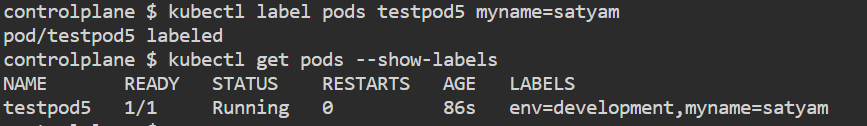
Listing pods based on labels
kubectl get pods -l env=developmentkubectl get pods -l env!=developmentTo delete a pod using label
kubectl delete pods -l env=development
In Kubernetes, there are two types of selectors that can be used to match and select resources based on their labels: equality-based selectors and set-based selectors.
Equality-based selectors
kubectl get pods -l app=frontend
kubectl get pods -l app!=frontend
kubectl get pods -l class=pods,name=satyam
Set-based selectors
kubectl get pods -l 'app in (frontend, backend)'
kubectl get pods -l 'app notin (frontend, backend)'
Node Selectors
Node selectors are used to schedule pods onto specific nodes in the cluster based on node labels. By using node selectors, you can control which nodes are eligible for running specific pods.
apiVersion: v1
kind: Pod
metadata:
  name: nodelabels
  labels:
    env: development
spec:
    containers:
       - name: c00
         image: ubuntu
         command: ["/bin/bash", "-c", "while true; do echo Hello; sleep 5 ; done"]
    nodeSelector:
       hardware: t2-medium
Note: It’s important to note that if no nodes match the specified node selector, the pod will remain in the “Pending” state until a matching node becomes available.
kubectl get podskubectl describe pod nodelabels
kubectl label nodes <node_name> <label_key>=<label_value>
kubectl label nodes <node_name> hardware=t2-medium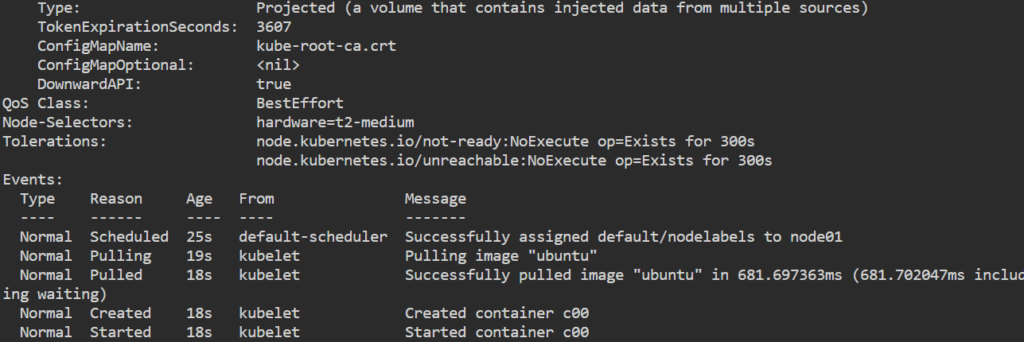
Node Affinity
Node selector and node affinity are two ways to specify the nodes where a pod should be scheduled in a Kubernetes cluster, based on specific criteria like labels or other attributes. Node selector uses a basic key-value matching mechanism, while node affinity provides more advanced rule-based matching.
Node Affinity uses a combination of label selectors, operators, and values to match nodes. The operators include In, NotIn, Exists, and DoesNotExist, and they can be combined with logical operators such as AND and OR to create more complex rules. This allows users to create rules that are based on node attributes such as CPU architecture, memory, region, or custom labels.
Node Affinity Types:
- requiredDuringSchedulingIgnoredDuringExecution
– Ensure that the pod is only scheduled on nodes that match the specified node selector rules.
– If no nodes match the node selector rules, the pod remains unscheduled. - preferredDuringSchedulingIgnoredDuringExecution
– The scheduler will attempt to schedule the pod on a node that matches one of the rules.
– If no nodes match any of the rules, the pod may be scheduled on any node.
Example 1:
apiVersion: apps/v1
kind: Deployment
metadata:
  name: nginx
spec:
  replicas: 1
  selector:
    matchLabels:
      app: nginx
  template:
    metadata:
      labels:
        app: nginx
    spec:
      containers:
        - name: nginx
          image: nginx
          ports:
            - containerPort: 80
      affinity:
        nodeAffinity:
          requiredDuringSchedulingIgnoredDuringExecution:
            nodeSelectorTerms:
              - matchExpressions:
                  - key: disktype
                    operator: In
                    values:
                      - ssd
Example 2:
apiVersion: apps/v1
kind: Deployment
metadata:
  name: nginx
spec:
  replicas: 5
  selector:
    matchLabels:
      app: nginx
  template:
    metadata:
      labels:
        app: nginx
    spec:
      containers:
        - name: nginx
          image: nginx
          ports:
            - containerPort: 80
      affinity:
        nodeAffinity:
          requiredDuringSchedulingIgnoredDuringExecution:
            nodeSelectorTerms:
              - matchExpressions:
                  - key: disktype
                    operator: In
                    values:
                      - ssd
              - matchExpressions:
                  - key: price
                    operator: In
                    values:
                      - ondemand
Example 3:
apiVersion: apps/v1
kind: Deployment
metadata:
  name: nginx
spec:
  replicas: 1
  selector:
    matchLabels:
      app: nginx
  template:
    metadata:
      labels:
        app: nginx
    spec:
      containers:
        - name: nginx
          image: nginx
          ports:
            - containerPort: 80
      affinity:
        nodeAffinity:
          preferredDuringSchedulingIgnoredDuringExecution:
            - weight: 1
              preference:
                matchExpressions:
                  - key: disktype
                    operator: In
                    values:
                      - ssd
Example 4:
apiVersion: apps/v1
kind: Deployment
metadata:
  name: nginx
spec:
  replicas: 1
  selector:
    matchLabels:
      app: nginx
  template:
    metadata:
      labels:
        app: nginx
    spec:
      containers:
        - name: nginx
          image: nginx
          ports:
            - containerPort: 80
      affinity:
        nodeAffinity:
          preferredDuringSchedulingIgnoredDuringExecution:
            - weight: 1
              preference:
                matchExpressions:
                  - key: disktype
                    operator: In
                    values:
                      - ssd
            - weight: 50
              preference:
                matchExpressions:
                  - key: price
                    operator: In
                    values:
                      - spot
Pod Affinity and Pod Anti-Affinity
Pod anti-affinity can prevent the scheduler from locating a new pod on the same node as pods with the same labels if the label selector on the new pod matches the label on the current pod.
apiVersion: apps/v1
kind: Deployment
metadata:
  name: pod-anti-affinity
spec:
  replicas: 2
  selector:
    matchLabels:
      app: nginx-controller
  template:
    metadata:
      labels:
        app: nginx-controller
    spec:
      containers:
      - name: nginx
        image: nginx
        ports:
        - containerPort: 80
      affinity:
        podAntiAffinity:
          requiredDuringSchedulingIgnoredDuringExecution:
          - labelSelector:
              matchExpressions:
              - key: app
                operator: In
                values:
                - nginx-controller
Pod affinity can tell the scheduler to locate a new pod on the same node as other pods if the label selector on the new pod matches the label on the current pod.
apiVersion: apps/v1
kind: Deployment
metadata:
  name: pod-affinity
spec:
  replicas: 2
  selector:
    matchLabels:
      app: nginx-controller
  template:
    metadata:
      labels:
        app: nginx-controller
    spec:
      containers:
      - name: nginx
        image: nginx:1.14.2
        ports:
        - containerPort: 80
      affinity:
        podAffinity:
          requiredDuringSchedulingIgnoredDuringExecution:
          - labelSelector:
              matchExpressions:
              - key: app
                operator: In
                values:
                - nginx-controller
Kubernetes Events
Kubernetes Events are created when other resources have state changes, errors, or other messages that should be broadcast to the system. It provides insight into what is happening inside a cluster.
To get the Events
kubectl get eventsNote: All the events are stored in the master server and to avoid filling up master’s disk, a retention policy is enforced i.e. events are removed one hour after the last occurrence. To provide longer history and aggregation capabilities, a third party solution should be installed to capture events.
Create a pod and then check for events
kubectl run demo-pod --image=nginx
kubectl get events
Note: Events are namespaced. Hence if you want event of a pod in “dev-namespace” then you will have to explicitly specify the –namespace dev-namespace.
kubectl get events -n dev-namespaceField Selectors
Field selectors let you select Kubernetes resources based on the value of one or more resource fields.
metadata.name=my-servicemetadata.namespace!=defaultstatus.phase=Pending
kubectl get pods --field-selector status.phase=Running
kubectl get services --all-namespaces --field-selector metadata.namespace!=default
kubectl get pods --field-selector=status.phase!=Running,spec.restartPolicy=Always
kubectl get pods --all-namespaces --field-selector metadata.namespace!=default
Note: By default, no selectors/filters are applied, meaning that all resources of the specified type are selected. This makes the kubectl queries kubectl get pods and kubectl get pods --field-selector "" equivalent.
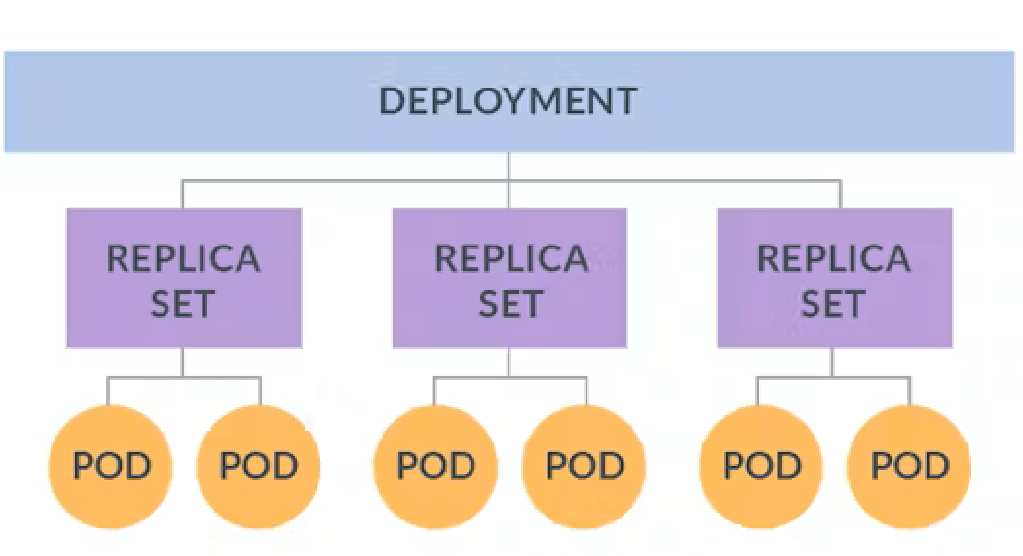
ReplicaSets and Deployments
Scaling in Kubernetes refers to increase or decrease the number of pod instances running to meet the changing demand or to distribute the workload across multiple nodes.
Note: Replication Controller is an older, deprecated resource that was used for managing and ensuring the desired number of pod replicas are running in a cluster. It has been replaced by more advanced controllers like Deployments and ReplicaSets . The difference between Replication Controller and ReplicaSets is that Replication Controller only supports equality-based selectors whereas the ReplicaSets supports equality-based selectors as well as set-based selectors i.e. filtering according to set of values.
ReplicaSets
ReplicaSets ensure a specific number of pod replicas are running at any given time. They act as a supervisor for pods and maintain the desired state defined in the ReplicaSet configuration. If a pod fails or is deleted, the ReplicaSet automatically creates a new pod to maintain the desired replica count.
apiVersion: apps/v1
kind: ReplicaSet
metadata:
  name: myrs
  labels:
    myname: Satyam
spec:
  replicas: 2
  selector:
    matchLabels:
      myname: Satyam
  template:
    metadata:
      name: testpod
      labels:
        myname: Satyam
    spec:
     containers:
       - name: c00
         image: ubuntu
         command: ["/bin/bash", "-c", "while true; do echo satyam; sleep 5 ; done"]
kubectl apply -f demo.ymlkubectl get rskubectl get pods
To scale down
kubectl scale --replicas=1 rs/myrs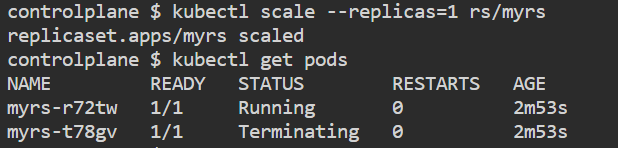
If you try to delete pod, it will auto scale and launch the desired no. of pods
kubectl delete pod myrs-<pod_name>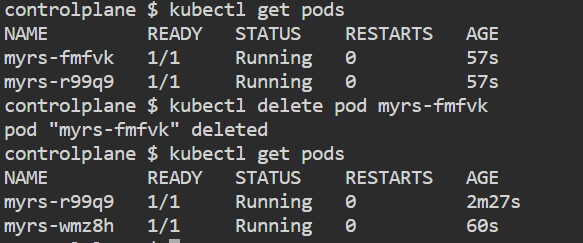
To delete ReplicaSets
kubectl delete rs/myrsDeployments
Deployments are the recommended way to manage replica sets and pods in Kubernetes. They provide declarative updates, scaling, and rollback capabilities. Deployments define the desired state of a set of pods, and the underlying ReplicaSet ensures that the desired number of pod replicas is running at all times.
apiVersion: apps/v1
kind: Deployment
metadata:
   name: mydeployments
   labels:
    name: deployment
spec:
   replicas: 2
   selector:
    matchLabels:
     name: deployment
   template:
     metadata:
       name: testpod
       labels:
         name: deployment
     spec:
      containers:
        - name: c00
          image: ubuntu
          command: ["/bin/bash", "-c", "while true; do echo satyam; sleep 5; done"]
Use cases of Deployments
- Create a deployment to rollout a ReplicaSet
- By updating the file of the deployment, a new ReplicaSet is created along with the desired no. of pods. The new ReplicaSet is same as a old ReplicaSet but the pods which are created are new pods because pods can’t be restarted. Instead a new pod is created. If we rollback, the old ReplicaSet will again get started and new pods are created.
- Cleanup older ReplicaSet that you don’t need anymore
- If there are problems in the deployment, Kubernetes will automatically rollback to the previous version however you can also explicitly rollback to a specific version.
kubectl get deployThe command “kubectl get deploy” is used to retrieve information about Deployments in a Kubernetes cluster.
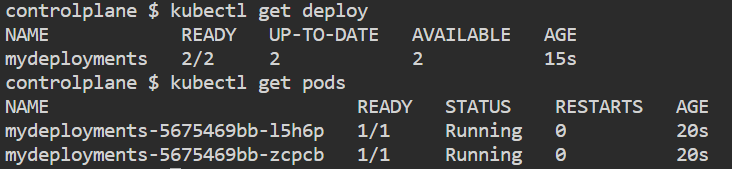
kubectl get deploy mydeployments -o yaml
kubectl get rs
kubectl scale --replica=1 deploy mydeploymentsTo scale up or down
kubectl logs -f <pod_name>To check, what is running inside container

kubectl rollout status deploy mydeploymentsIt provides information about the current status of the Deployment and whether the rollout has completed or is still in progress.
kubectl rollout history deploy mydeployments
kubectl rollout history deploy mydeployments --revision 2
It displays a list of revisions (rollout history) associated with the specified Deployment, including the revision number and any relevant annotations.
kubectl rollout undo deploy mydeployments
kubectl rollout undo deploy mydeployments --to-revision=2
It reverts the Deployment to the previous revision, effectively rolling back the Deployment to its previous state.
Deployment may get struck trying to deploy its newest ReplicaSet. This can occur due to following factors:
- Insufficient Quota
- Readiness probe failures
- Image pull errors
- Insufficient permissions
- Limit Ranges
- Application runtime misconfiguration
Note:
- Deployments for stateless apps that can be horizontally scaled and do not persist any data
- Best practices to host database outside of the Kubernetes cluster
Kubernetes Deployment Strategies
Rolling Update Deployment
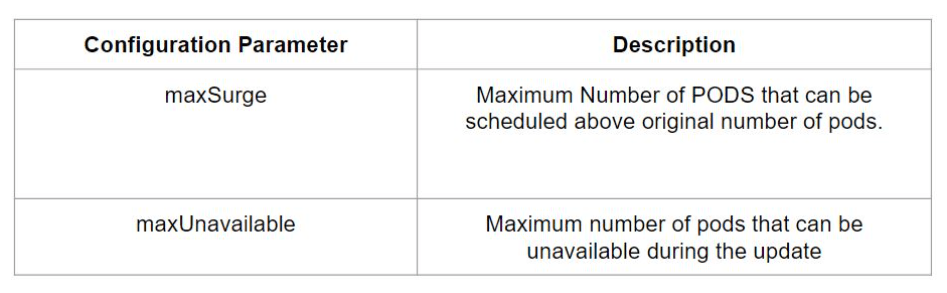
While performing a rolling update, there are two important configurations to know:
For ex:
maxSurge=25%
maxUnavailable=25%
Total pods in deployment = 8
maxSurge = 2 Pods (Atmost 10 pods (8 current Pods + 2 maxSurge Pods))
maxUnavailable = 2 Pods (Atleast 6 pods (6 current Pods – 2 maxUnavailable Pods))
apiVersion: apps/v1
kind: Deployment
metadata:
  name: myapp
spec:
  replicas: 8
  strategy:
    type: RollingUpdate
    rollingUpdate:
      maxUnavailable: 25%
      maxSurge: 25%
  selector:
    matchLabels:
      app: myapp
  template:
    metadata:
      labels:
        app: myapp
    spec:
      containers:
        - name: myapp
          image: httpd
          ports:
            - name: http
              containerPort: 80
Recreate Deployment
Recreate deployment strategy can be dangerous because it can cause downtime. No matter how many pods you have under that deployment, when you trigger the upgrade all of them will be immediately terminated and replaced by new ones with a new version. This type is frequently used in development, when you don’t really care about the downtime.
apiVersion: apps/v1
kind: Deployment
metadata:
  name: myapp
spec:
  replicas: 3
  strategy:
    type: Recreate
  selector:
    matchLabels:
      app: myapp
  template:
    metadata:
      labels:
        app: myapp
    spec:
      containers:
        - name: myapp
          image: httpd
          ports:
            - name: http
              containerPort: 80
Blue/Green Deployment
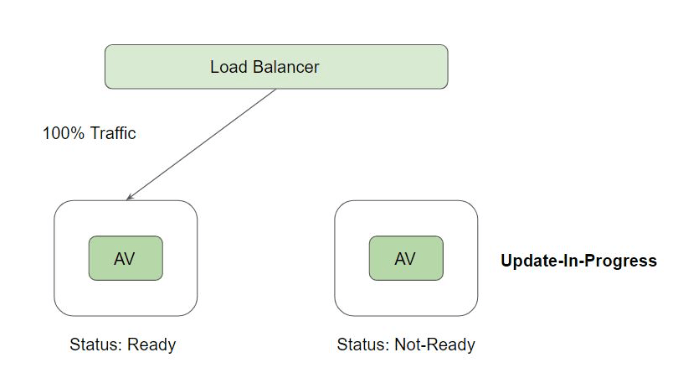
A Blue/Green deployment involves deploying the new application version (green) alongside the old one (blue). A load balancer in the form of the service selector object is used to direct the traffic to the new application (green) instead of the old one when it has been tested and verified. Blue/Green deployments can prove costly as twice the amount of application resources need to be stood up during the deployment period.

vim blue-deployment.ymlapiVersion: apps/v1
kind: Deployment
metadata:
name: blue-myapp
namespace: default
spec:
replicas: 2
selector:
matchLabels:
app: myapp
replica: blue
template:
metadata:
labels:
app: myapp
replica: blue
spec:
containers:
- name: myapp
image: httpd
ports:
- containerPort: 80
vim green-deployment.ymlapiVersion: apps/v1
kind: Deployment
metadata:
name: green-myapp
namespace: default
spec:
replicas: 2
selector:
matchLabels:
app: myapp
replica: green
template:
metadata:
labels:
app: myapp
replica: green
spec:
containers:
- name: myapp2
image: nginx
ports:
- containerPort: 80vim service.ymlapiVersion: v1
kind: Service
metadata:
name: myapp
namespace: default
spec:
selector:
app: myapp
replica: blue
ports:
- protocol: TCP
port: 80
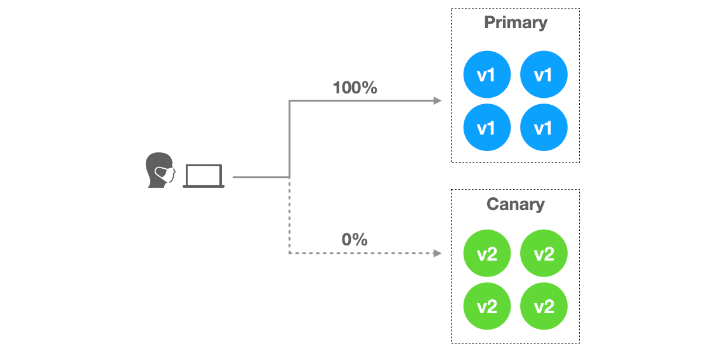
targetPort: 80Canary Deployment
In both canary and blue-green strategies, the old version and the new version of the application get deployed at the same time. But while the canary strategy slowly routes the traffic to the new version, the blue-green strategy quickly routes all traffic to one of the versions.
For example, in a K8 cluster with 100 running pods, 95 could be running v1.0.0 of the application, with 5 running the new v2.0.0 of the application. 95% of the users will be routed to the old version, and 5% will be routed to the new version. For this, we use 2 deployments side-by-side that can be scaled separately.
Old application manifest
spec:
  replicas: 95
New application manifest
spec:
  replicas: 5
Kubernetes Networking
Kubernetes networking is a critical aspect of managing and connecting applications and services within a Kubernetes cluster. It enables communication between pods, services, and external resources, facilitating seamless and reliable networking between components.
Here are key concepts related to Kubernetes networking:
- Pods are the smallest unit in Kubernetes and represent a group of one or more containers. Containers within a pod share the same network namespace, allowing them to communicate with each other using
localhost. Pods are assigned unique IP addresses within the cluster. - Cluster networking enables communication between different pods and nodes within the cluster. It establishes the network connectivity that allows pods and nodes to communicate and exchange data.
Container to Container communication on same pod
PODs can contain group of containers that share the same network and storage resources, and run in a shared context and communication between the containers inside pods happens via localhost. Kubernetes make use of Pause containers for share networking.
apiVersion: v1
kind: Pod
metadata:
  name: testpod
spec:
  containers:
    - name: c00
      image: ubuntu
      command: ["/bin/bash", "-c", "while true; do echo Hello; sleep 5 ; done"]
    - name: c01
      image: httpd
      ports:
       - containerPort: 80
kubectl apply -f demo.ymlkubectl get podsTo go inside container
kubectl exec testpod -it -c c00 -- /bin/bashapt update && apt install curlcurl localhost:80
kubectl delete -f demo.ymlPod to Pod communication on same node
Pod to Pod communication on same worker node happen through pod IP. By default, pod IP will not be accessible outside the node
vim pod1.ymlapiVersion: v1
kind: Pod
metadata:
name: testpod
spec:
containers:
- name: c00
image: nginx
ports:
- containerPort: 80vim pod2.ymlapiVersion: v1
kind: Pod
metadata:
name: testpod2
spec:
containers:
- name: c01
image: httpd
ports:
- containerPort: 80kubectl apply -f pod1.yml
kubectl apply -f pod2.yml
kubectl get pods -o wide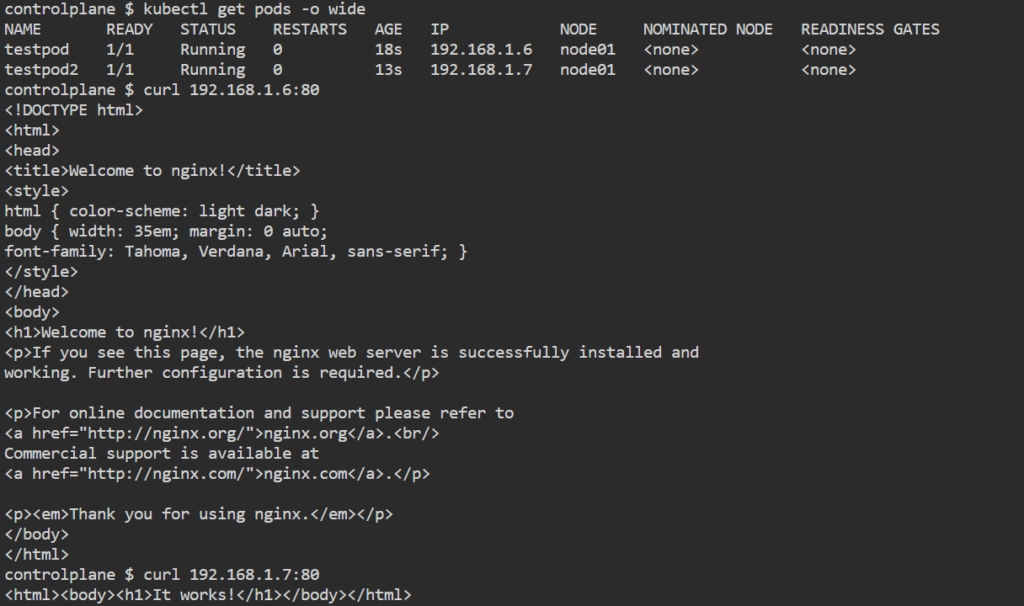
curl 192.168.1.6:80
curl 192.168.1.7:80
Services
Reason why we need services:
- Pods in Kubernetes have dynamic IP addresses that can change when they are rescheduled, recreated, or scaled. This makes it challenging to establish stable connections and maintain reliable communication with pods directly
- When multiple replicas of a pod are running, distributing incoming traffic across these replicas becomes important to ensure scalability, high availability, and even resource utilization. Without load balancing provided by Services, you would need to implement your own load balancing mechanisms, which adds complexity and maintenance overhead.
- In a dynamic and distributed environment like Kubernetes, discovering and connecting to pods individually by their IP addresses is not practical. Services simplify this process by providing a consistent and stable endpoint that can be used for accessing the pods.

Service is an abstraction that provides a consistent and stable network endpoint to access a set of pods. Service allows clients to reliably connect to containers running in the pod using the virtual IP. The virtual IP is not an actual IP connected to network interface but its purpose is purely to forward traffic to one or more pods.
Kube-proxy is the one which keeps the mapping between the virtual IP and the pods upto date which queries the API server to learn about new services in the cluster
We know that although each pod has a unique IP address, but those IP’S are not exposed outside the cluster. Services helps to expose the virtual IP mapped to the pods and allows application to receive traffic. Labels are used to select which are the pods to be put under a service.
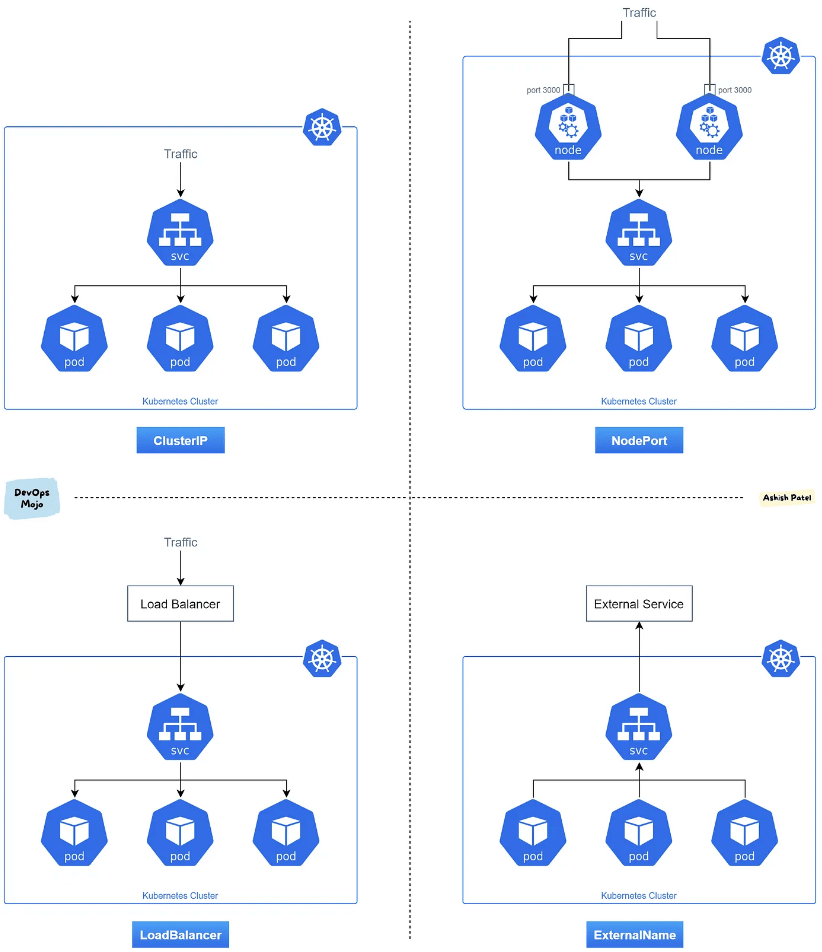
Types of services:
- ClusterIP: This is the default type and provides internal access within the cluster. The Service is assigned a virtual IP (ClusterIP) that is only reachable from within the cluster. It allows communication between pods or other resources within the same namespace.
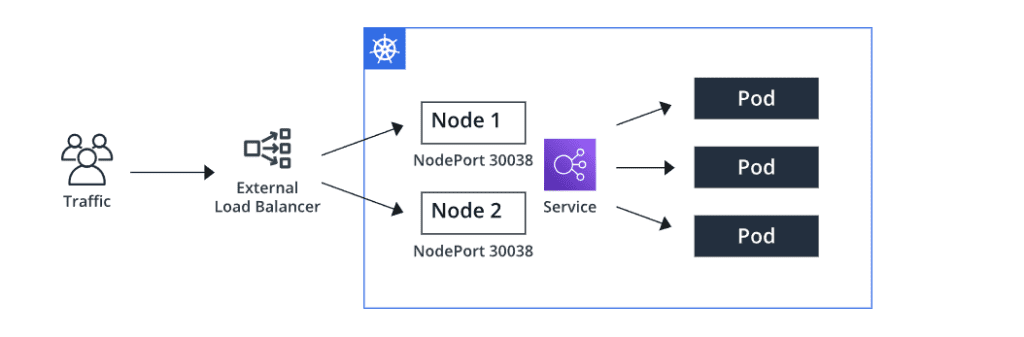
- NodePort: In addition to the ClusterIP, NodePort exposes the Service on a static port on each node’s IP address. It allows external access to the Service by forwarding traffic from the specified port on the node to the Service. This type is commonly used when you need to access the Service from outside the cluster, such as during development or testing.
- LoadBalancer: The LoadBalancer type requests an external load balancer (if supported by the underlying cloud provider) to be created and assigns an external IP address to the Service. This allows traffic to be distributed to the Service from outside the cluster. This type is commonly used to expose Services externally to the cluster. Also, the
LoadBalancertype doesn’t support URL routing, SSL termination, etc. - ExternalName: The ExternalName type is used to map a Service to an external DNS name without any selectors or pods associated with it. It allows the Service to be accessed by its external DNS name instead of an IP address.
Note: By default, service can only run between ports 30000-32767
ClusterIP
vim demo.yml apiVersion: apps/v1
kind: Deployment
metadata:
name: mydeployments
labels:
name: deployment
spec:
replicas: 1
selector:
matchLabels:
name: deployment
template:
metadata:
name: testpod1
labels:
name: deployment
spec:
containers:
- name: c00
image: httpd
ports:
- containerPort: 80kubectl apply -f demo.yml
kubectl get pods -o wide
curl <IP>:80vim service.ymlapiVersion: v1
kind: Service
metadata:
name: demoservice
spec:
ports:
- port: 80
targetPort: 80
selector:
name: deployment
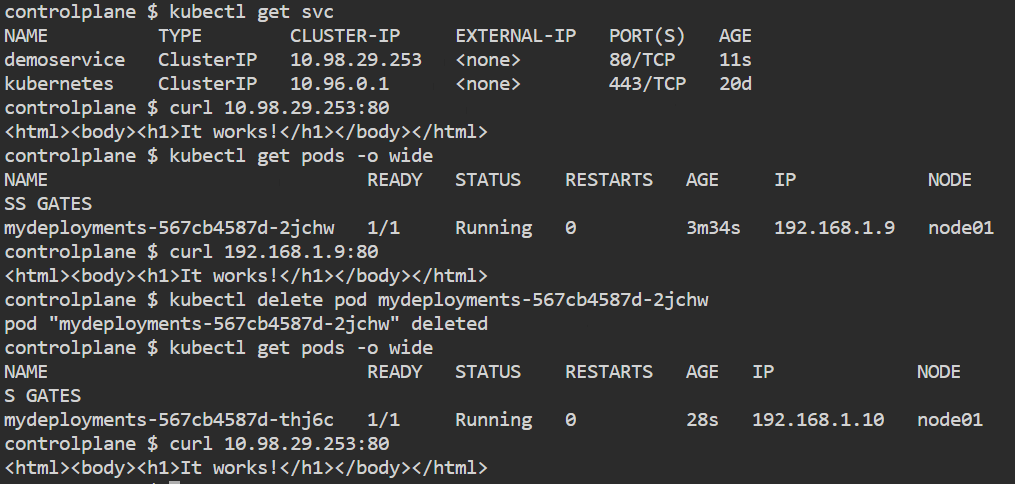
type: ClusterIP kubectl apply -f service.yml
kubectl describe service demoservicekubectl get svc
curl <IP>:80Now we delete the pod and we can see the another pod which is now deployed has different IP but we can access it through by service virtual static IP.
NodePort
vim demo.yml apiVersion: apps/v1
kind: Deployment
metadata:
name: mydeployments
labels:
name: deployment
spec:
replicas: 1
selector:
matchLabels:
name: deployment
template:
metadata:
name: testpod1
labels:
name: deployment
spec:
containers:
- name: c00
image: httpd
ports:
- containerPort: 80kubectl apply -f demo.yml
kubectl get pods -o widevim service.ymlapiVersion: v1
kind: Service
metadata:
name: demoservice
spec:
type: NodePort
ports:
- port: 80
targetPort: 80
nodePort: 30007
selector:
name: deployment kubectl apply -f service.yml
kubectl get svc
curl 10.97.202.137:80
kubectl get nodes -o wide
curl 127.0.0.1:30007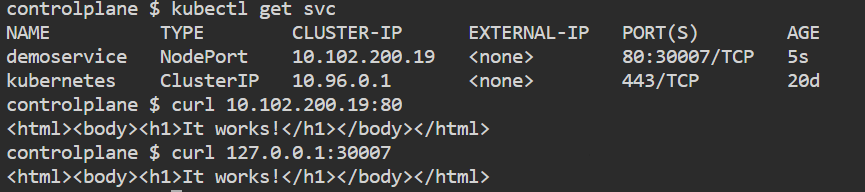
LoadBalancer
vim frontend.yml apiVersion: apps/v1
kind: Deployment
metadata:
name: myapp-frontend
labels:
name: frontend
spec:
replicas: 2
selector:
matchLabels:
name: frontend
template:
metadata:
labels:
name: frontend
spec:
containers:
- name: frontend
image: satyam19arya/social_media_frontend
ports:
- containerPort: 3000vim service.ymlapiVersion: v1
kind: Service
metadata:
name: frontend-service
spec:
selector:
name: frontend
type: LoadBalancer
ports:
- port: 80
protocol: TCP
targetPort: 3000Ingress
Before the ingress, for each service that we wanted to expose to the internet or simply outside of the Kubernetes cluster, we had to create a service of type LoadBalancer. The problem with that approach is that Kubernetes will create a dedicated load balancer in the cloud for each service you want to expose. This can be expensive and so to solve this issue, ingress was introduced.

Now instead of creating multiple load balancers for each service, we now only need to maintain a single one.
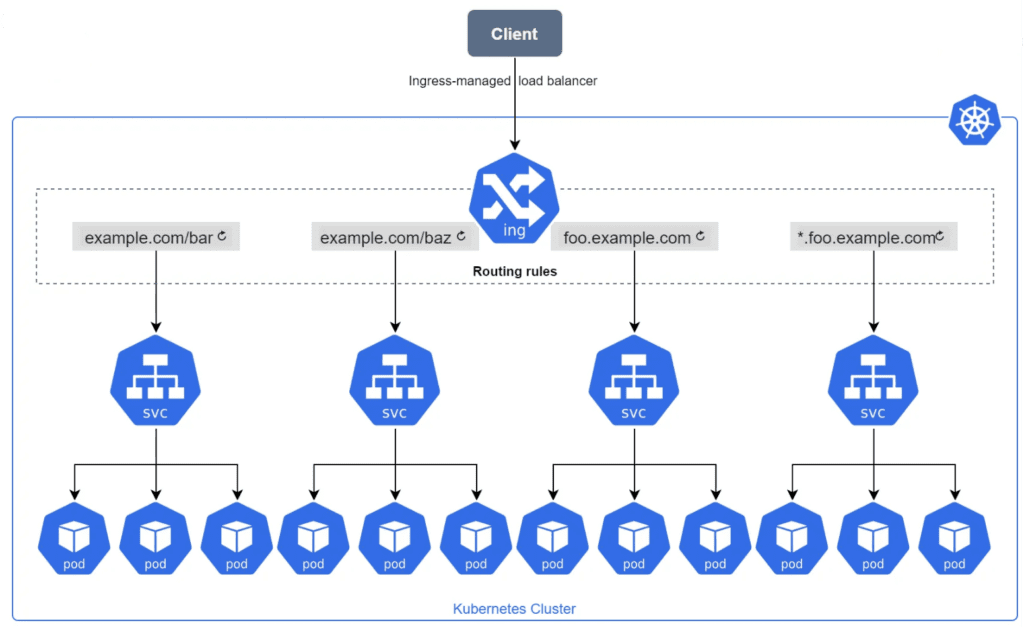
An Ingress is an object that allows access to Kubernetes services from outside the Kubernetes cluster. Ingress exposes HTTP and HTTPS routes from outside the cluster to services within the cluster. Traffic routing is controlled by rules defined on the Ingress resource.
In order for the Ingress resource to work, the cluster must have an ingress controller running. An Ingress controller is a specialized load balancer for Kubernetes that provides reverse proxy, configurable traffic routing, and TLS termination for Kubernetes services.
- Ingress Resource: An Ingress resource in Kubernetes is an API object that defines rules for how external HTTP/S traffic should be processed and directed to services within the cluster. It allows you to expose multiple services through a single IP address and manage routing, SSL/TLS termination, and other features.
- Ingress Controller: An Ingress controller is a component responsible for fulfilling the rules set in the Ingress resource. It acts as a reverse proxy and is usually deployed as a separate pod within the cluster. The Ingress controller watches for changes in the Ingress resources and reconfigures itself dynamically to apply the specified rules. Commonly used Ingress controllers include Nginx Ingress Controller etc.
If you want to route traffic based on subdomains and paths:
apiVersion: networking.k8s.io/v1
kind: Ingress
metadata:
  name: my-ingress
spec:
  rules:
    - host: app.mydomain.com
      http:
        paths:
          - path: /
            pathType: Prefix
            backend:
              service:
                name: app-service
                port:
                  number: 80
    - host: api.mydomain.com
      http:
        paths:
          - path: /v1
            pathType: Prefix
            backend:
              service:
                name: api-service
                port:
                  number: 8080
          - path: /v2
            pathType: Prefix
            backend:
              service:
                name: api-service-v2
                port:
                  number: 8081
kubectl get ingress
kubectl describe ingress my-ingressTo deploy Ingress-Nginx Controller (Using Helm)
helm upgrade --install ingress-nginx ingress-nginx --repo https://kubernetes.github.io/ingress-nginx --namespace ingress-nginx --create-namespaceVerify it
helm list --all-namespaceskubectl get ingressclass
kubectl get service -n ingress-nginxAdd ingressClassName in ingress resource file
apiVersion: networking.k8s.io/v1
kind: Ingress
metadata:
  name: my-ingress
spec:
  ingressClassName: nginx
  rules:
    - host: app.mydomain.com
      http:
        paths:
          - path: /
            pathType: Prefix
            backend:
              service:
                name: app-service
                port:
                  number: 80
    - host: api.mydomain.com
      http:
        paths:
          - path: /v1
            pathType: Prefix
            backend:
              service:
                name: api-service
                port:
                  number: 8080
To deploy AWS ALB Ingress Controller

curl -O https://raw.githubusercontent.com/kubernetes-sigs/aws-load-balancer-controller/v2.5.4/docs/install/iam_policy.json
aws iam create-policy --policy-name AWSLoadBalancerControllerIAMPolicy --policy-document file://iam_policy.json
eksctl utils associate-iam-oidc-provider --region=us-east-1 --cluster=three-tier-cluster --approve
eksctl create iamserviceaccount --cluster=three-tier-cluster --namespace=kube-system --name=aws-load-balancer-controller --role-name AmazonEKSLoadBalancerControllerRole --attach-policy-arn=arn:aws:iam::626072240565:policy/AWSLoadBalancerControllerIAMPolicy --approve --region=us-east-1
sudo snap install helm --classic
helm repo add eks https://aws.github.io/eks-charts
helm repo update eks
helm install aws-load-balancer-controller eks/aws-load-balancer-controller -n kube-system --set clusterName=my-cluster --set serviceAccount.create=false --set serviceAccount.name=aws-load-balancer-controller
kubectl get deployment -n kube-system aws-load-balancer-controllerapiVersion: networking.k8s.io/v1
kind: Ingress
metadata:
name: my-ingress
annotations:
alb.ingress.kubernetes.io/scheme: internet-facing
alb.ingress.kubernetes.io/target-type: ip
alb.ingress.kubernetes.io/listen-ports: '[{"HTTP": 80}]'
spec:
ingressClassName: alb
rules:
- host: app.mydomain.com
http:
paths:
- path: /
pathType: Prefix
backend:
service:
name: app-service
port:
number: 80
- host: api.mydomain.com
http:
paths:
- path: /v1
pathType: Prefix
backend:
service:
name: api-service
port:
number: 8080
- path: /v2
pathType: Prefix
backend:
service:
name: api-service-v2
port:
number: 8081Cloud Controller Manager
The cloud controller manager lets you link your cluster into your cloud provider’s API, and separates out the components that interact with that cloud platform from components that only interact with your cluster.
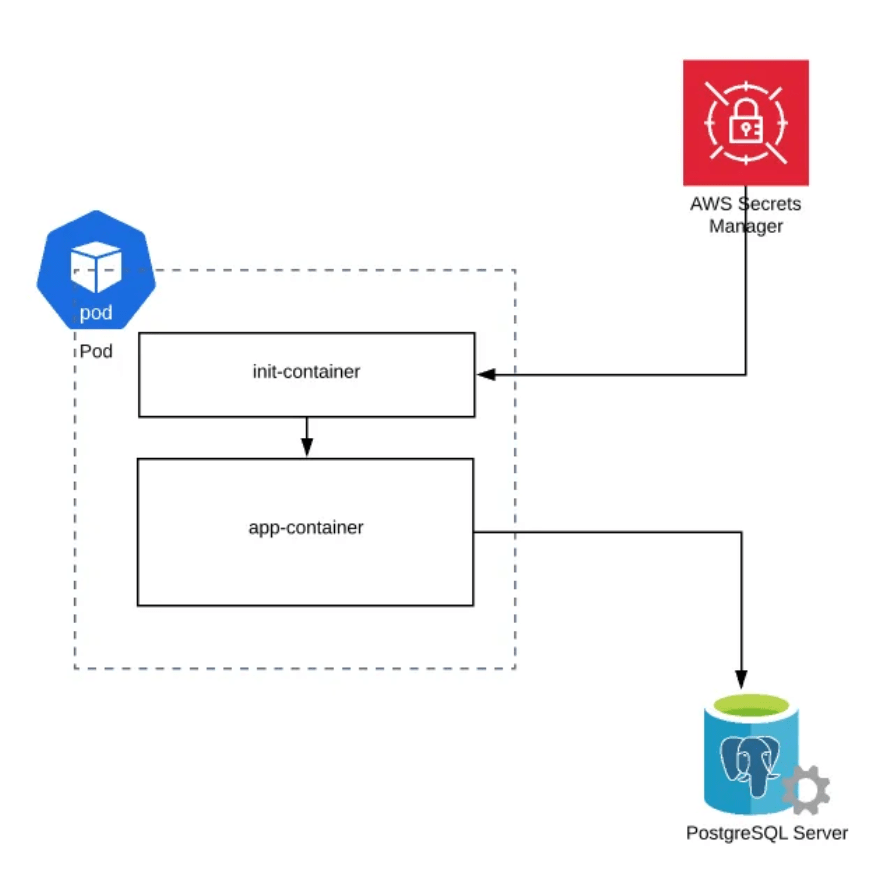
Init Containers
Init containers are just like regular containers, but they run to completion and run before the main container starts. There are various use cases for init containers, such as init containers can contain certain utilities or custom code for the setup that is not present for the app container. There can be one or more init containers. It will be running sequentially. The first init container runs, and then it completes. Then the second one runs, it completes, and then the containers will start.
Since init containers are part of the same Pod, they share the volumes, network, security settings, and resource limits, just like any other container in the Pod.
Note: init containers do not support livenessProbe, readinessProbe, or startupProbe whereas sidecar containers support all these probes to control their lifecycle.
Example: This example defines a simple Pod that has two init containers. The first waits for myservice, and the second waits for mydb.
apiVersion: v1
kind: Pod
metadata:
  name: myapp-pod
  labels:
    app.kubernetes.io/name: MyApp
spec:
  containers:
  - name: myapp-container
    image: busybox:1.28
    command: ['sh', '-c', 'echo The app is running! && sleep 3600']
  initContainers:
  - name: init-myservice
    image: busybox:1.28
    command: ['sh', '-c', "until nslookup myservice.$(cat /var/run/secrets/kubernetes.io/serviceaccount/namespace).svc.cluster.local; do echo waiting for myservice; sleep 2; done"]
  - name: init-mydb
    image: busybox:1.28
    command: ['sh', '-c', "until nslookup mydb.$(cat /var/run/secrets/kubernetes.io/serviceaccount/namespace).svc.cluster.local; do echo waiting for mydb; sleep 2; done"]
Note: The above int container runs the command to wait until the DNS resolution for myservice and mydb is successful using nslookup. It checks the DNS entry for the service in the same namespace as the Pod. The loop sleeps for 2 seconds between attempts.
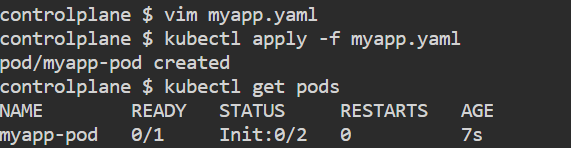
kubectl apply -f myapp.yaml
kubectl get pods
At this point, both init containers will be waiting to discover Services named mydb and myservice.
vim services.yamlapiVersion: v1
kind: Service
metadata:
name: myservice
spec:
ports:
- protocol: TCP
port: 80
targetPort: 9376
---
apiVersion: v1
kind: Service
metadata:
name: mydb
spec:
ports:
- protocol: TCP
port: 80
targetPort: 9377kubectl apply -f services.yaml
kubectl get pods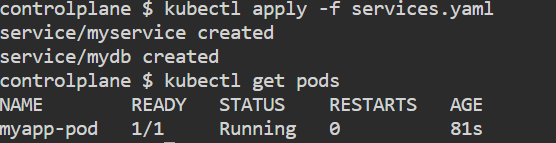
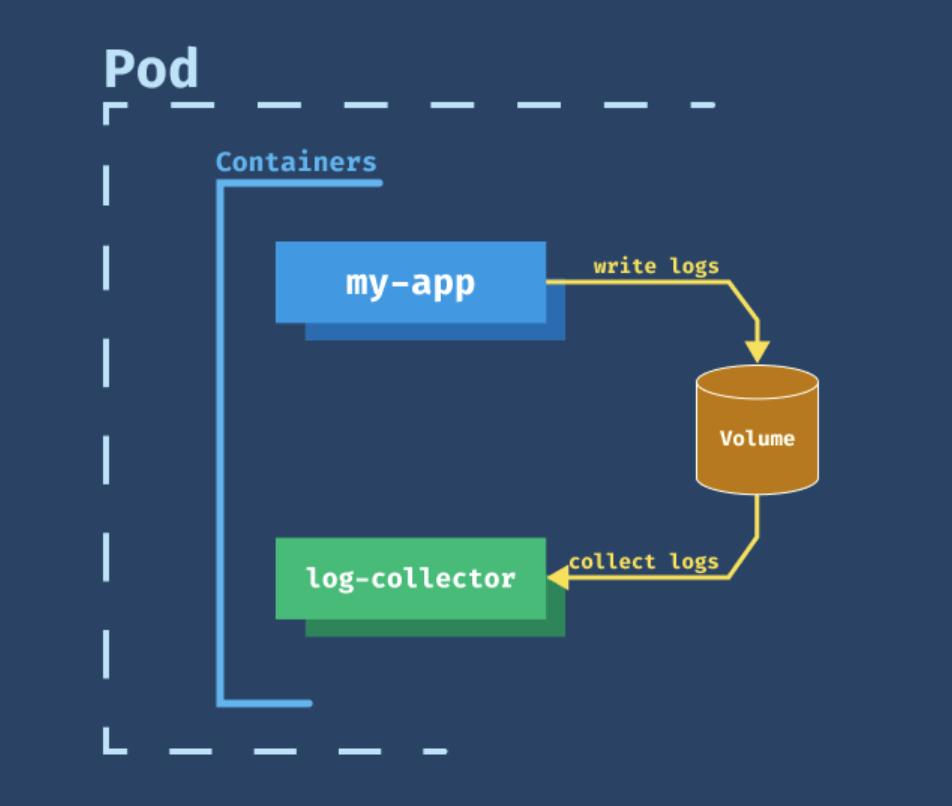
Sidecar Containers
In comparison to the init container, the sidecar container starts and runs simultaneously as your application container. The sidecar is just a second container you have in your container list, and the startup order is not guaranteed. A simpler idea might be having a sidecar container (log-collector) that collects and stores application container’s logs. That way, as an application developer, you don’t need to worry about collecting and storing logs. You only need to write logs to a location (a volume, shared between the containers) where the sidecar container can collect them and send them to further processing or archive them.
Ambassador Containers
An Ambassador container is a sidecar container that is in charge of proxying connections from the application container to other services. When you are running applications on Kubernetes it’s a high chance that you should access the data from the external services. The Ambassador container hides the complexity and provides the uniform interface to access these external services.
For example, almost all applications need a database connection at some phase. In a multi-environment place, there would be a test database, a staging database, and a production database. When writing the Pod definition for their application’s container, developers must pay attention to which database they’ll be connecting to. A database connection string can be easily changed through an environment variable or a configMap. We could also use a sidecar pattern that proxies DB connections to the appropriate server depending on where it runs. Developers needn’t change the connection string, they could leave the DB server at localhost as usual. When deployed to a different environment, the Ambassador container detects which environment it is running on and connects to the correct server.

Example:

apiVersion: v1
kind: ConfigMap
metadata:
  name: ambassador-config
data:
  haproxy.cfg: |-
    global
        daemon
        maxconn 256

    defaults
        mode http
        timeout connect 5000ms
        timeout client 50000ms
        timeout server 50000ms

    listen http-in
        bind *:80
        server server1 127.0.0.1:9080 maxconn 32

---
apiVersion: v1
kind: Pod
metadata:
  name: ambassador
spec:
  containers:
  - name: haproxy-container
    image: haproxy:1.7
    volumeMounts:
    - name: config-volume
      mountPath: /usr/local/etc/haproxy
  - name: demo-nginx
    image: mykplabs/kubernetes:nginx
  volumes:
  - name: config-volume
    configMap:
      name: ambassador-config

---
apiVersion: v1
kind: Pod
metadata:
  name: busybox
spec:
  containers:
  - name: curl-container
    image: yauritux/busybox-curl
    command: ['sh', '-c', 'while true; do sleep 3600; done']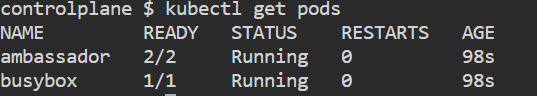
kubectl exec -it ambassador bash
apt-get update
apt install net-tools
netstat -ntlp
exit
kubectl exec -it busybox sh
curl 192.168.1.4:9080
curl 192.168.1.4:80
curl 192.168.1.4
Note: “netstat -ntlp” is used to display active network connections and listening ports on a Linux system
Adapter containers
The adapter container pattern’s main function is to manipulate the application’s output or logs.
For ex, Prometheus works by querying an endpoint exposed by the target application. The endpoint must return the diagnostic data in a format that Prometheus expects. A possible solution is to configure each application to output its health data in a Prometheus-friendly way. Changing the application code each time you need a new health-status format is largely inefficient. Following the Adapter Pattern, we can have a sidecar container in the same Pod as the app’s container. The only purpose of the sidecar (the adapter container) is to “translate” the output from the application’s endpoint to a format that Prometheus accepts and understands.

In our example, we needed to expose our application metrics in a way that Prometheus understands. However, no changes should be made to the application container. The metrics transformation is done through the adapter container.
Static Pods
Static Pods are managed directly by the kubelet daemon on a specific node, without the API server observing them. Unlike Pods that are managed by the control plane (for example, a Deployment); instead, the kubelet watches each static Pod (and restarts it if it fails). Pod created directly without schedulers are also referred to as Static Pods. The Pods running on a node are visible on the API server, but cannot be controlled from there. The Pod names will be suffixed with the node hostname with a leading hyphen.
Note: The spec of a static Pod cannot refer to other API objects (e.g., ServiceAccount, ConfigMap, Secret, etc).
cd /etc/kubernetes/manifests
ls
vim demopod.yml
kubectl get pods
rm -f demopod.yml
Volumes
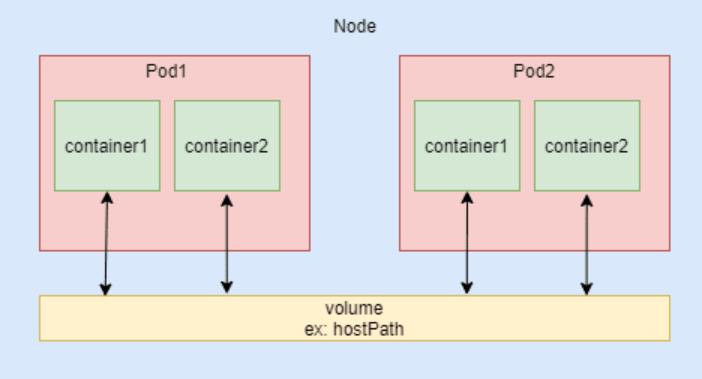
- Containers are short lived in nature.
- All data stored inside a container is deleted if the container crashes. To overcome this problem, Kubernetes uses volumes.
- A volume is essentially a directory backed by a storage medium.
- In Kubernetes, a volume is attached to a pod and shared among the containers of that pod.
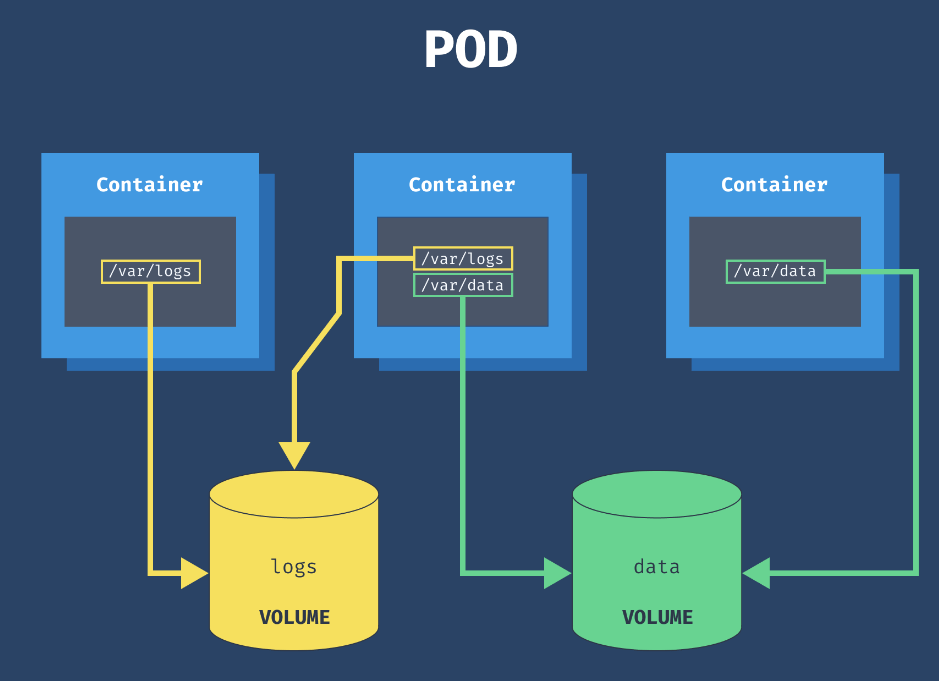
Volume types
- emptyDir: An empty directory is created and attached to a pod. It’s useful for temporary data sharing between containers in the same pod. Data in an emptyDir volume is erased when the pod restarts or is deleted.
- hostPath: This volume mounts a directory from the host node’s filesystem into the pod. It’s useful for accessing files on the node itself, but it’s less portable and not recommended for production workloads.
- persistentVolumeClaim (PVC): PVCs provide a way to use and manage persistent storage in a cluster. They abstract the underlying storage details from the application and enable dynamic provisioning of storage resources.
- awsElasticBlockStore (EBS): EBS volumes are specific to AWS and provide block storage that can be attached to EC2 instances and then mounted to pods.
- azureDisk: Similar to EBS, Azure Disk volumes are specific to Azure and provide persistent block storage for pods.
- azureFile: Azure File volumes enable pods to mount Azure File Shares, which are fully managed file shares in the Azure cloud.
emptyDir
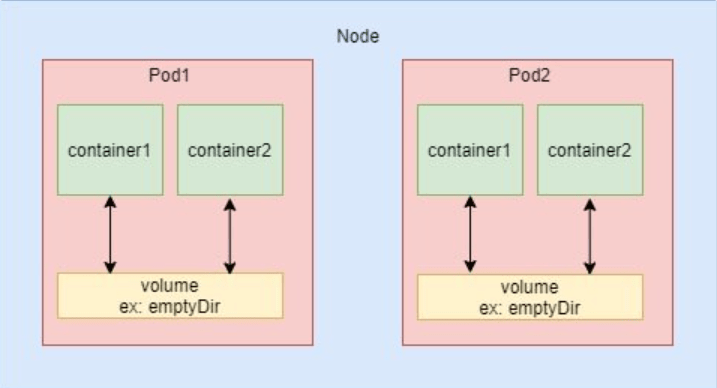
- emptyDir is useful when we want to share contents between multiple containers on the same pod and not to the host machine
- An emptyDir volume is first created when a pod is assigned to a node and exist as long as that pod is running on that node
vim emptydir.ymlapiVersion: v1
kind: Pod
metadata:
name: myvolemptydir
spec:
containers:
- name: c1
image: centos
command: ["/bin/bash", "-c", "sleep 15000"]
volumeMounts:
- name: xchange
mountPath: "/tmp/xchange"
- name: c2
image: centos
command: ["/bin/bash", "-c", "sleep 10000"]
volumeMounts:
- name: xchange
mountPath: "/tmp/data"
volumes:
- name: xchange
emptyDir: {}kubectl apply -f emptydir.yml
kubectl get pods
kubectl exec myvolemptydir -c c1 -it -- /bin/bash
cd /tmp/xchange
ls
touch demofile.txt
exit
kubectl exec myvolemptydir -c c2 -it -- /bin/bash
cd /tmp/data
ls
exit
kubectl delete -f emptydir.yml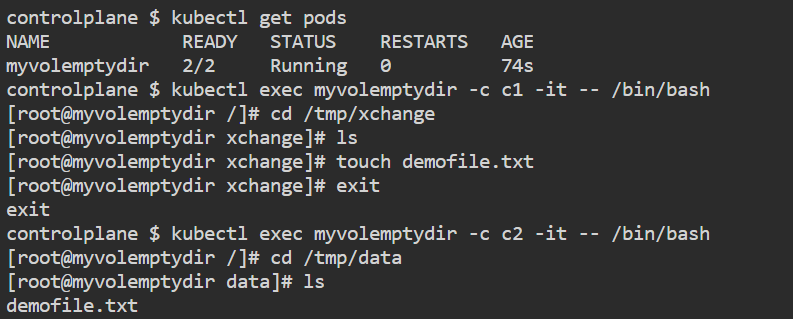
hostPath
vim hostpath.ymlapiVersion: v1
kind: Pod
metadata:
name: myvolhostpath
spec:
containers:
- image: nginx
name: test
volumeMounts:
- mountPath: /data
name: testvolume
volumes:
- name: testvolume
hostPath:
path: /mydata
type: Directorymkdir mydata
kubectl apply -f hostpath.yml
kubectl get pods
cd /mydata
touch demo.txt
kubectl exec myvolhostpath -- ls /data
kubectl delete -f hostpath.ymlpersistentVolumeClaim
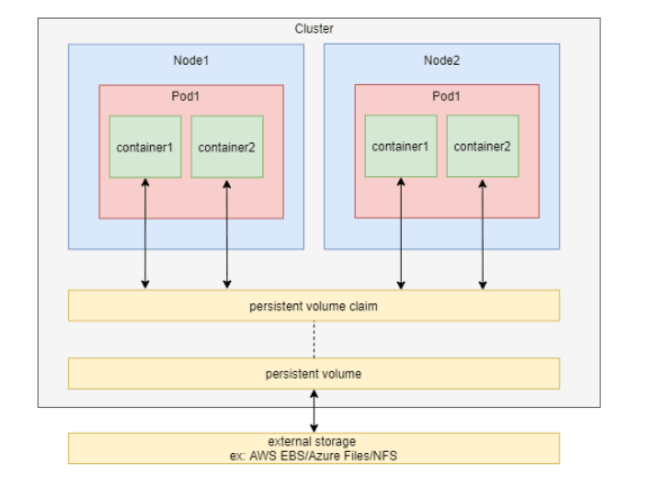
- In order to use a persistent volume, we need to claim it first using persistentVolumeClaim (PVC).
- When you create a PVC, you specify the desired storage capacity and other attributes such as access mode (e.g., read-write once, read-only many) and storage class. Then PVC request a persistent volume with your desired specification from Kubernetes.
- Once a suitable PV is found, the PVC and the PV are bound together. This binding ensures that the requested storage is reserved for the specific PVC.
- PVCs and PVs have their own lifecycles. When a PVC is deleted, its corresponding PV may be released and made available for other PVCs to use, depending on the reclaim policy specified in the PV’s configuration.
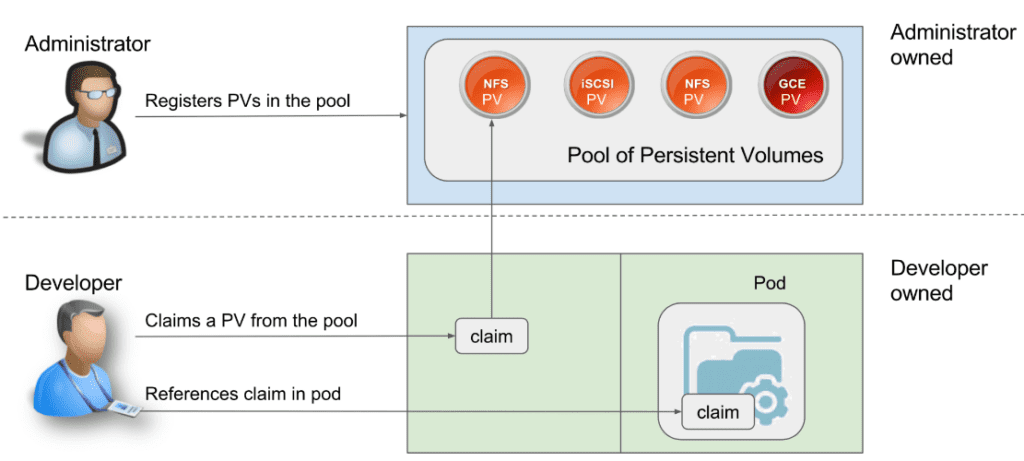
In short,
- Storage Administrator creates a PV and takes care of it.
- Developer creates a PVC to request storage and claim the PV.
- Developer reference that claim with the podSpec file.
vim mypv.ymlapiVersion: v1
kind: PersistentVolume
metadata:
name: mongo-pv
spec:
storageClassName: manual
capacity:
storage: 256Mi
accessModes:
- ReadWriteOnce
hostPath:
path: /tmp/dbkubectl apply -f mypv.yml
kubectl get pvvim mypvc.ymlapiVersion: v1
kind: PersistentVolumeClaim
metadata:
name: mongo-pvc
spec:
storageClassName: manual
accessModes:
- ReadWriteOnce
resources:
requests:
storage: 256Mikubectl apply -f mypvc.yml
kubectl get pvcvim deploypvc.ymlapiVersion: apps/v1
kind: Deployment
metadata:
name: mongo
spec:
replicas: 1
selector:
matchLabels:
app: mongo
template:
metadata:
labels:
app: mongo
spec:
containers:
- name: mongo
image: mongo
ports:
- containerPort: 27017
volumeMounts:
- name: storage
mountPath: /data/db
volumes:
- name: storage
persistentVolumeClaim:
claimName: mongo-pvc
---
apiVersion: v1
kind: Service
metadata:
name: mongo
spec:
ports:
- port: 27017
targetPort: 27017
selector:
app: mongokubectl apply -f deploypvc.yml
kubectl get deploy
kubectl get pods
kubectl get svcThere are two ways PVs may be provisioned: statically or dynamically.
- Static: A cluster administrator creates a number of PVs. They carry the details of the real storage, which is available for use by cluster users.
- Dynamic: When none of the static PVs the administrator created match a user’s PersistentVolumeClaim, the cluster may try to dynamically provision a volume specially for the PVC. This provisioning is based on StorageClasses: the PVC must request a storage class and the administrator must have created and configured that class for dynamic provisioning to occur.
Volume Expansion
Step 1: Enable volume expansion in the Storage Class
To enable the volume expansion feature, make sure the storage (StorageClass) description contains allowVolumeExpansion: true. In Managed Service for Kubernetes storage, this feature is enabled by default.
kubectl get storageclasskind: StorageClass
apiVersion: storage.k8s.io/v1
metadata:
name: yc-network-hdd
provisioner: disk-csi-driver.mks.ycloud.io
volumeBindingMode: WaitForFirstConsumer
parameters:
type: network-hdd
csi.storage.k8s.io/fstype: ext4
allowVolumeExpansion: true
reclaimPolicy: Delete
Step 2: Create a PersistentVolumeClaim object
apiVersion: v1
kind: PersistentVolumeClaim
metadata:
  name: pvc-expansion
spec:
  accessModes:
    - ReadWriteOnce
  storageClassName: yc-network-hdd
  resources:
    requests:
      storage: 1Gi
kubectl apply -f pvc-expansion.yamlStep 3: Create a pod with a dynamically provisioned volume
apiVersion: v1
kind: Pod
metadata:
  name: pod
spec:
  containers:
  - name: app
    image: ubuntu
    command: ["/bin/sh"]
    args: ["-c", "while true; do echo $(date -u) >> /data/out.txt; sleep 5; done"]
    volumeMounts:
    - name: persistent-storage
      mountPath: /data
  volumes:
  - name: persistent-storage
    persistentVolumeClaim:
      claimName: pvc-expansion
kubectl apply -f pod.yamlStep 4: Delete the pod with the volume
To request volume expansion, you need to delete the pod.
kubectl delete pod podStep 5: Resizing the PVC
kubectl edit pvc pvc-expansionapiVersion: v1
kind: PersistentVolumeClaim
metadata:
...
spec:
accessModes:
- ReadWriteOnce
resources:
requests:
storage: 1Gi # Change the value to 2Gi.
...
status:
accessModes:
- ReadWriteOnce
capacity:
storage: 1Gi
phase: Boundkubectl get pvc pvc-expansion -o yamlStep 6: Create a pod with a volume
kubectl apply -f pod.yamlLivenessProbe
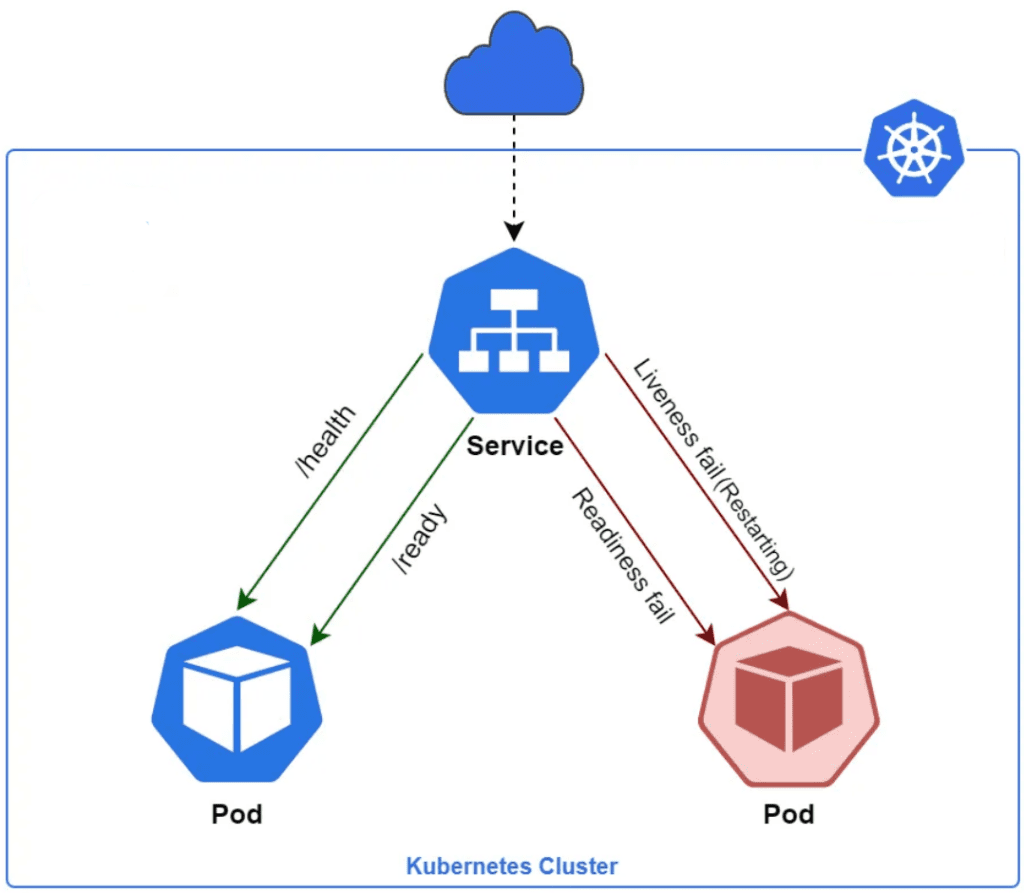
- In order to verify if a container in a pod is healthy and ready to serve traffic, Kubernetes provides a range of healthy check mechanism. Ex – LivenessProbe
- A LivenessProbe is a diagnostic tool that checks whether a container is alive and responsive. It helps Kubernetes determine whether a container should be restarted. If the LivenessProbe fails, Kubernetes considers the container to be unhealthy and automatically recreate it.
- Kubelet uses liveness probes to know when to restart a container. If the liveness probe fails, the kubelet kills the container, and the container is subjected to its restart policy
- For running healthchecks, we would use cmds specific to the application. If the cmd succeeds, it returns 0 and the kubelet considers the container to be alive and healthy. If the command returns a non-zero value, the kubectl kills the pod and recreate it.
vim liveness.ymlapiVersion: v1
kind: Pod
metadata:
name: liveness-exec
spec:
containers:
- name: liveness
image: ubuntu
args:
- /bin/sh
- -c
- touch /tmp/healthy; sleep 1000
livenessProbe:
exec:
command:
- cat
- /tmp/healthy
initialDelaySeconds: 5
periodSeconds: 5
timeoutSeconds: 30 kubectl apply -f liveness.yml
kubectl get pods
kubectl exec <pod_name> -it -- /bin/bash
cat /tmp/healthy
echo $?
cat /tmp/satyam
echo $?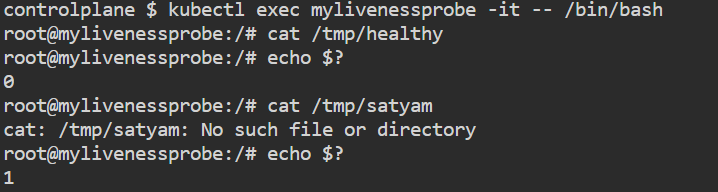
Example 2:
apiVersion: v1
kind: Pod
metadata:
  name: liveness
spec:
  containers:
  - name: liveness
    image: ubuntu
    tty: true
    livenessProbe:
      exec:
        command:
        - service
        - nginx
        - status
      initialDelaySeconds: 20
      periodSeconds: 5
Note: Above command will give an error in two cases – Firstly, if nginx is not installed and secondly if nginx is installed but not running.
There are 3 types of probes which can be used with Liveness:
- HTTP
- Command
- TCP
Readiness probes
Sometimes, applications are temporarily unable to serve traffic. For example, an application might need to load large data or configuration files during startup, or making connection with database takes time. In such cases, you don’t want to kill the application, but you don’t want to send it requests either. Kubernetes provides readiness probes to detect and mitigate these situations.
Readiness probes are configured similarly to liveness probes. The only difference is that you use the readinessProbe field instead of the livenessProbe field.
apiVersion: v1
kind: Pod
metadata:
  name: readiness
spec:
  containers:
  - name: readiness
    image: ubuntu
    tty: true
    readinessProbe:
     exec:
       command:
       - cat
       - /tmp/healthy
     initialDelaySeconds: 5
     periodSeconds: 5
kubectl apply -f readinessProbe.yml
kubectl get pods
kubectl exec -it readiness touch /tmp/healthy
kubectl get pods
kubectl exec -it readiness rm /tmp/healthy
kubectl get pods
kubectl exec -it readiness cat /tmp/healthyStartup Probe
Startup probe is typically used with legacy applications that take a very long time to start, such as some old Java applications. This probe just delays liveness and readiness probes.
apiVersion: v1
kind: Pod
metadata:
  name: startup-http
spec:
  containers:
    - name: startup
      image: nginx
      livenessProbe:
        httpGet:
          path: /
          port: 80
        initialDelaySeconds: 3
        periodSeconds: 10
      readinessProbe:
        httpGet:
          path: /
          port: 80
        initialDelaySeconds: 3
        periodSeconds: 5
      startupProbe:
        httpGet:
          path: /
          port: 80
        initialDelaySeconds: 30
        periodSeconds: 10
ConfigMap and Secrets
A ConfigMap is essentially a key-value store where you define various configuration parameters, such as environment variables, command-line arguments, or configuration files. It is a way to store and manage configuration data separately from the application code.
A Secret is a resource used to securely store sensitive information, such as passwords, tokens, or API keys, separately from the main application code or configuration. Secrets are designed to keep this sensitive data safe and ensure it is not easily exposed or leaked. The API server store secrets as plain text in etcd.
There are multiple risks of hard coding credentials:
- Anyone having access to the container repo can easily fetch the credentials
- Developer need to have credentials of production systems.
- Update of credentials will lead to new docker image being built.

vim secret.ymlapiVersion: v1
kind: Secret
metadata:
name: mysql-secret
type: Opaque
data:
password: dHJhaW53aXRoc2h1YmhhbQ==kubectl apply -f secret.yaml
kubectl get secretvim configmap.ymlapiVersion: v1
kind: ConfigMap
metadata:
name: mysql-config
data:
MYSQL_DB: "todo-db"kubectl apply -f configmap.yml
kubectl get configmapvim deployment.ymlapiVersion: apps/v1
kind: Deployment
metadata:
name: mysql
labels:
app: mysql
spec:
replicas: 1
selector:
matchLabels:
app: mysql
template:
metadata:
labels:
app: mysql
spec:
containers:
- name: mysql
image: mysql:8
ports:
- containerPort: 3306
env:
- name: MYSQL_ROOT_PASSWORD
valueFrom:
secretKeyRef:
name: mysql-secret
key: password
- name: MYSQL_DATABASE
valueFrom:
configMapKeyRef:
name: mysql-config
key: MYSQL_DBkubectl apply -f deployment.ymlOther options to store secrets: AWS Secrets Manager, AWS Systems Manager Parameter Store, HashiCorp vault
Two approaches for mounting secrets and configMap in containers:
- Volumes
- Env variables
apiVersion: v1
kind: Pod
metadata:
  name: demo-secret
spec:
  containers:
  - name: test-container
    image: nginx
    volumeMounts:
    - name: secret-volume
      readOnly: true
      mountPath: "/etc/secret-volume"
  volumes:
  - name: secret-volume
    secret:
      secretName: first-secret
apiVersion: v1
kind: Pod
metadata:
name: configmap-pod
spec:
containers:
- name: configmap-container
image: nginx
volumeMounts:
- name: config-volume
mountPath: /etc/config
volumes:
- name: config-volume
configMap:
name: first-config
restartPolicy: NeverNamespaces
A namespaces is a logical grouping of Kubernetes resources. They are implemented using labels, which are key-value pairs that can be attached to Kubernetes resources. If you are using Kubernetes to manage a large number of resources, or if you are working with multiple teams or projects, then you should consider using namespaces. Namespaces can help you to organize, secure, and manage your Kubernetes resources more effectively.
Namespaces can be used to:
- Separate different projects or teams from each other.
- Control access to resources based on user or group identity.
- Isolate resources from each other for testing or development purposes.
- Manage resource quotas for different namespaces.

Note:
- By default, Kubernetes creates a single namespace called
default. This namespace is used for all resources that are not explicitly assigned to a different namespace. You can create as many namespaces as you need, and you can move resources between namespaces as needed. - Most Kubernetes resources (pods, services, ReplicaSet and others) are in the same namespace and low-level resources such as nodes and persistent Volumes are not in any namespace.
kubectl get namespaces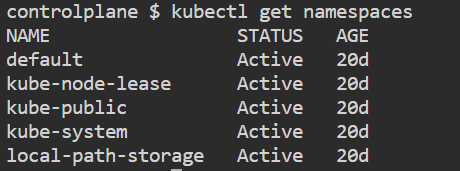
vim devns.ymlapiVersion: v1
kind: Namespace
metadata:
name: dev
labels:
name: devkubectl apply -f devns.yml
kubectl get namespaces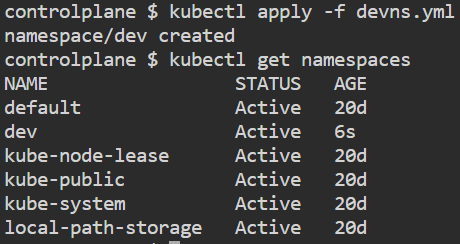
vim pod.ymlkind: Pod
apiVersion: v1
metadata:
name: testpod
spec:
containers:
- name: c00
image: ubuntu
command: ["/bin/bash", "-c", "while true; do echo satyam; sleep 5 ; done"]kubectl apply -f pod.yml -n dev
kubectl get pods -n dev
kubectl delete -f pod.yml -n devTo set default namespace
kubectl config set-context $(kubectl config current-context) --namespace=dev
kubectl config view | grep namespace:
DaemonSet
A DaemonSet ensures that all nodes run a copy of a Pod. As nodes are added to the cluster, Pods are added to them. As nodes are removed from the cluster, those Pods are garbage collected. Deleting a DaemonSet will clean up the Pods it created.
Some typical uses of a DaemonSet are:
- running a logs collection daemon on every node
- running a node monitoring daemon on every node
vim daemonset.yamlapiVersion: apps/v1
kind: DaemonSet
metadata:
name: kplabs-daemonset
spec:
selector:
matchLabels:
name: kplabs-all-pods
template:
metadata:
labels:
name: kplabs-all-pods
spec:
containers:
- name: kplabs-pods
image: nginxkubectl apply -f daemonset.yaml
kubectl get nodes
kubectl get pods -o wideResource Quota
- A pod in Kubernetes will run with no limits on CPU and memory.
- You can optionally specify how much CPU and memory each container needs.
- A resource quota in Kubernetes is an object that allows administrators to restrict the amount of resources that can be consumed by a namespace. Quotas can be used to prevent one team from using too many resources and starving other teams, or to ensure that there is always enough capacity for all users.
Two types of constraints can be set for each resource type – Request and Limits
A request is the amount of that resources that the system will guarantee for the container.
A limit is the maximum amount of resources that Kubernetes will allow the container to use.
Note:
- If a request is not set for a container, it defaults to the limit.
- If request is defined and limit is not set, then limit default to 0.
- A request must always be less than or equal to the limit.
- A container can never use more resources than its limit, but it can use less than its request.
vim podresources.ymlapiVersion: v1
kind: Pod
metadata:
name: resources
spec:
containers:
- name: resource
image: centos
command: ["/bin/bash", "-c", "while true; do echo satyam; sleep 5 ; done"]
resources:
requests:
memory: "64Mi"
cpu: "100m"
limits:
memory: "128Mi"
cpu: "200m"kubectl apply -f podresources.yml
kubectl get pods
kubectl describe pod <pod_name>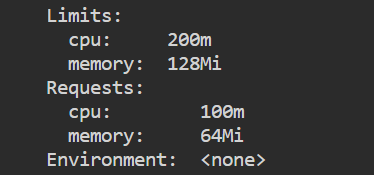
Horizontal Pod Autoscaling
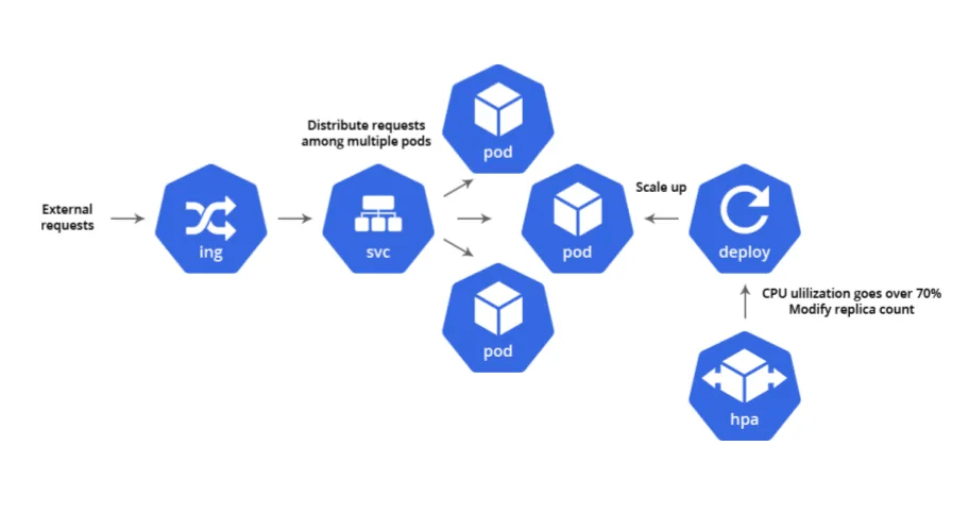
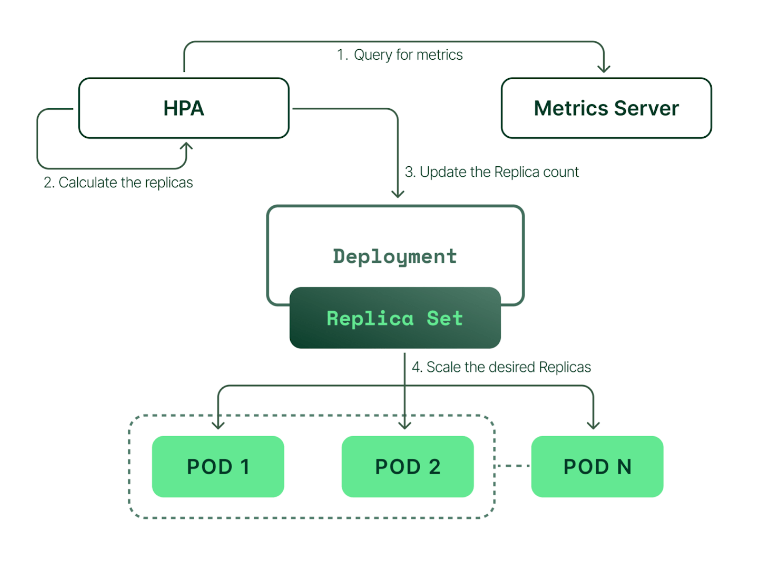
Horizontal Pod Autoscaling (HPA) is a Kubernetes feature that automatically scales the number of Pods in a Deployment, replica set based on a set of metrics. This allows you to ensure that your application has the resources it needs to handle demand, without having to manually scale your cluster.
HPA works by monitoring the metrics you specify, such as CPU usage or memory usage. When the metric exceeds a threshold, HPA will scale up the number of Pods until the metric falls below the threshold. Conversely, if the metric falls below a threshold, HPA will scale down the number of Pods.
HPA vs VPA vs Cluster Autoscaler
HPA operates at the pod level within existing nodes, adjusting the number of replicas to handle workload changes while Cluster Autoscaler, on the other hand, manages the number of worker nodes in the EKS Node Group, automatically scaling up or down nodes based on the overall resource demand while VPA is an autoscaler that enables automatic CPU and memory request and limit adjustments based on historical resource usage measurements within the existing nodes.
The Cluster Autoscaler doesn’t directly measure CPU and memory usage values to make a scaling decision. Instead, it checks every 10 seconds to detect any pods in a pending state, suggesting that the scheduler could not assign them to a node due to insufficient cluster capacity.
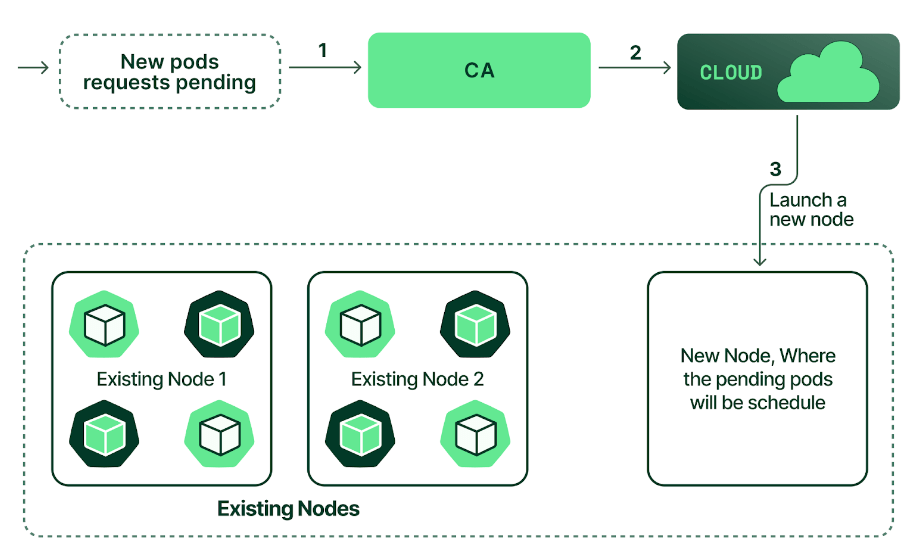
Note: Whenever there is a request to scale up the cluster, CA issues a scale-up request to a cloud provider within 30–60 seconds. The actual time the cloud provider takes to create a node can be several minutes or more. This delay means that your application performance may be degraded while waiting for the extended cluster capacity.
Note: In some clouds, such as AWS, you need to explicitly configure permissions and deploy your own cluster autoscaler controller. Others, such as Azure and GCP, allow you to simply check a box, and the cloud will deploy and manage it for you.
The problem with that approach is if you use large instance types and a single tiny pod does not fit onto the existing nodes, the cluster autoscaler will create another node with the same CPU and memory as all other nodes. In many cases, this can lead to wasted resources, and you would pay more than you actually use. To fix this issue, AWS developed another tool called Karpenter. It works with other clouds as well. Instead of simply scaling up your node group with the same instance types, Karpenter will analyze the pending pods and create EC2 instances directly with enough CPU and memory to fit the pending workloads.
You can also use serverless Kubernetes clusters provided by AWS, such as Fargate. When you create a pod, Kubernetes will spin up a dedicated node for it. In this case, you don’t have to manage your nodes yourself and worry about wasted resources. However, these serverless clusters are much more expensive in terms of how much you pay for CPU and memory compared to EC2. So, you might want to test it first before committing to the serverless approach, but it does reduce the maintenance of your infrastructure.
In short:
- Horizontal Pod Autoscaler (HPA): adjusts the number of replicas of an application.
- Cluster Autoscaler: adjusts the number of nodes of a cluster.
- Vertical Pod Autoscaler (VPA): adjusts the resource requests and limits of a container.
Note: HPA is typically used for stateless applications like web servers where adding or removing instances of the application does not affect the overall system state while VPA is generally more suited for stateful applications like databases that are difficult or impossible to scale horizontally.
Note: Keep in mind that you should never use HPA and VPA simultaneously targeting the same deployment. They will conflict with each other and may disrupts your workloads.
Limitations of HPA:
- HPA’s does not work with DaemonSets.
- If you don’t efficiently set CPU and memory limits on pods, your pods may terminate frequently or, on the other end of the spectrum, you’ll waste resources.
- If the cluster is out of capacity, HPA can’t scale up until new nodes are added to the cluster. Cluster Autoscaler (CA) can automate this process.
To implement Horizontal Pod Autoscaling (HPA) in Kubernetes, you need to follow these steps:
Step 1: Create an EKS cluster
Step 2: Install the Metrics Server (Optional step – depends upon Cloud Provider)
To check metrics server installed or not
kubectl top pods -n kube-systemTo install metrics server
kubectl apply -f https://github.com/kubernetes-sigs/metrics-server/releases/download/v0.5.0/components.yaml

Using HELM
helm repo add metrics-server https://kubernetes-sigs.github.io/metrics-server/
helm repo update
helm install metrics-server --namespace kube-system --version 3.11.0 metrics-server/metrics-server --set "args[0]=--kubelet-insecure-tls"
Verify it
kubectl get pods -n kube-system
kubectl get svc -n kube-system
kubectl top pods -n kube-system
kubectl top nodes
Now metrics server will scrap kubelet of each node and provide aggregated metrics to other components of your Kubernetes in your cluster via the metrics API.

To fetch raw data from the Metric Server API for pod metrics in the default namespace
kubectl get --raw http://127.0.0.1:8001/apis/metrics.k8s.io/v1beta1/namespaces/default/podsTo get output in JSON format
kubectl get --raw http://127.0.0.1:8001/apis/metrics.k8s.io/v1beta1/namespaces/default/pods | jq .Step 3: Deploy a sample application
Note: Do not set the replicas count in the deployment object if you are using a GitOps approach. In that case, HPA and tool such as ArgoCD or FluxCD will constantly fight to set the desired replicas count based on metrics.
apiVersion: apps/v1
kind: Deployment
metadata:
  name: myapp-backend
  labels:
    name: backend
spec:
  selector:
    matchLabels:
      name: backend
  template:
    metadata:
      labels:
        name: backend
    spec:
      containers:
      - name: backend
        image: satyam19arya/social_media_backend:build-45
        imagePullPolicy: Always
        ports:
        - containerPort: 4000
        resources:
          limits:
            cpu: 500m
            memory: "256Mi"
          requests:
            cpu: 200m
            memory: "128Mi"
kubectl apply -f deployment.ymlapiVersion: v1
kind: Service
metadata:
name: backend-service
spec:
selector:
name: backend
type: LoadBalancer
ports:
- port: 80
protocol: TCP
targetPort: 4000 kubectl apply -f service.yamlStep 4: Create an HPA Resource
apiVersion: autoscaling/v2
kind: HorizontalPodAutoscaler
metadata:
  name: hpa-backend-deployment
spec:
  scaleTargetRef:
    apiVersion: apps/v1
    kind: Deployment
    name: myapp-backend
  minReplicas: 2
  maxReplicas: 6
  metrics:
  - type: Resource
    resource:
      name: cpu
      target:
        type: Utilization
        averageUtilization: 50
kubectl apply -f hpa.yaml
kubectl get hpa
Step 5: Testing
To test HPA in real-time, let’s increase the load on the load balancer and check how HPA responds in managing the resources.
sudo yum install httpd-tools
ab -n 15000 -c 30 http://a27b000bbed3942d4a570354c3d20af2-1836581300.us-east-1.elb.amazonaws.com/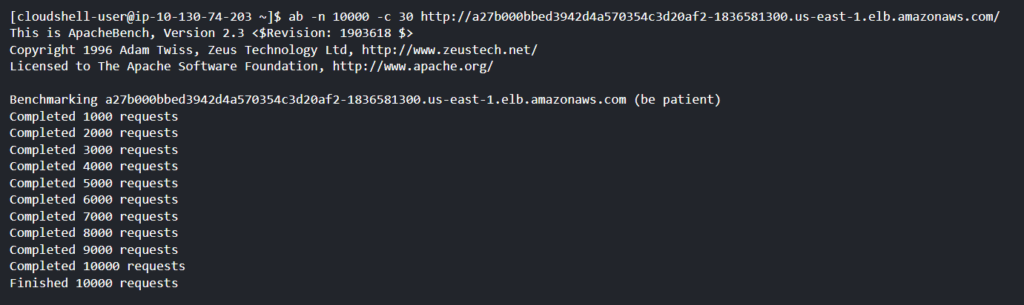
To watch the HPA in your Kubernetes cluster in real-time
kubectl get hpa -w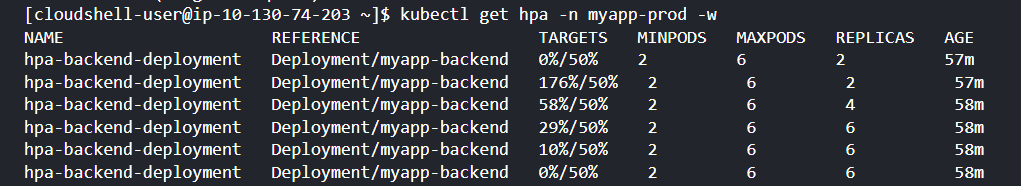
Another way to verify the status
kubectl get eventsNote: Autoscaling based on CPU or memory is not very accurate because different applications may have different requirements like scaling based on number of requests per second, response times, error rates, or any other key performance indicators (KPIs) for your particular application. One application may be fine running at 90% CPU usage while another may only handle 40% CPU usage. The best way to scale your app is to use more meaningful custom metrics. This might involve using tools like Prometheus to gather and expose custom metrics.
To read more: Click here
Jobs & CronJobs
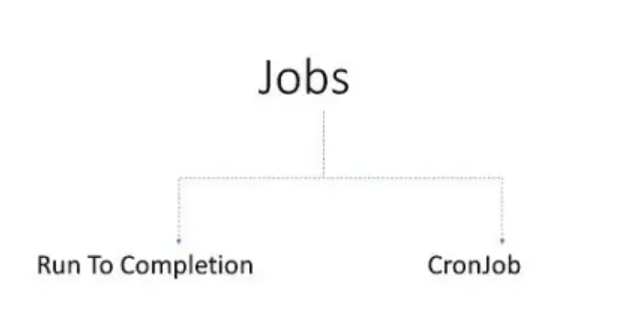
A Job creates one or more Pods and will continue to retry execution of the Pods until a specified number of them successfully terminate. As pods successfully complete, the Job tracks the successful completions. Once the task is completed, the pods are not terminated. Deleting a Job will clean up the Pods it created.
vim job.ymlapiVersion: batch/v1
kind: Job
metadata:
name: testjob
spec:
template:
metadata:
name: testjob
spec:
containers:
- name: testjob
image: centos:7
command: ["bin/bash", "-c", "echo satyam; sleep 5"]
restartPolicy: Neverkubectl apply -f job.yml
kubectl get pods
watch !!
kubectl logs testjob-r4kml
kubectl delete -f job.yml
CronJobs
CronJob allows us to run jobs based on a time schedule. Cron jobs are useful for creating periodic and recurring tasks, like running backups or sending emails.
vim cronjob.ymlapiVersion: batch/v1
kind: CronJob
metadata:
name: hello
spec:
schedule: "* * * * *"
jobTemplate:
spec:
template:
spec:
containers:
- name: hello
image: busybox:1.28
imagePullPolicy: IfNotPresent
command:
- /bin/sh
- -c
- date; echo Hello from the Kubernetes cluster
restartPolicy: OnFailure
kubectl apply -f cronjob.yml
kubectl get pods
watch !!
kubectl delete -f cronjob.yml
Note:
# ┌───────────── minute (0 - 59)
# │ ┌───────────── hour (0 - 23)
# │ │ ┌───────────── day of the month (1 - 31)
# │ │ │ ┌───────────── month (1 - 12)
# │ │ │ │ ┌───────────── day of the week (0 - 6) (Sunday to Saturday)
# │ │ │ │ │
# │ │ │ │ │
# │ │ │ │ │
# * * * * *
Cron schedule expression editor: Click here
Kubernetes Pod LifeCycle
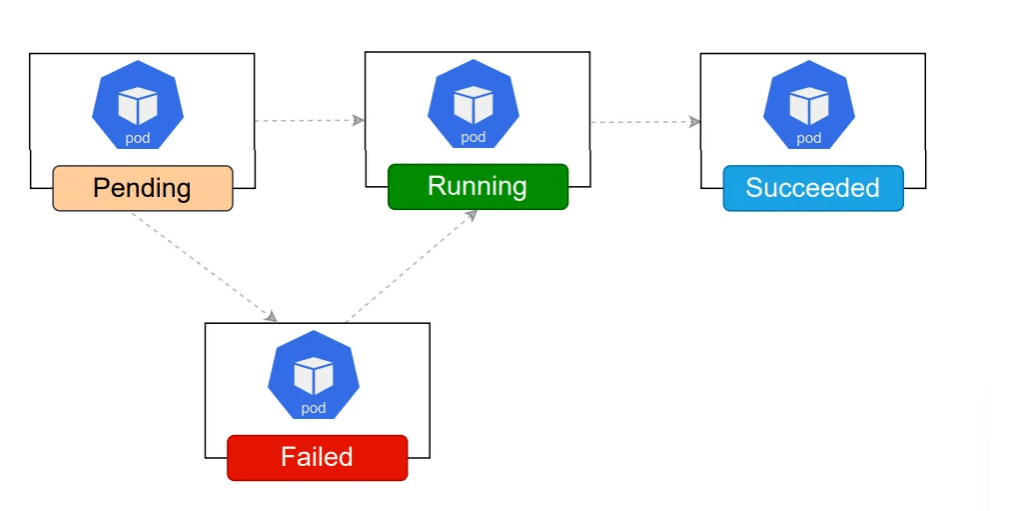
Every time we submit pod configuration to the Kubernetes cluster, it first comes in a pending state.
- The scheduler looks for the healthy worker node and kubelet will download all necessary container images and start creating the pod.
- This pod will remain in the pending state until all resources are up and ready.
- Once the scheduler finds the worker node to schedule, pods come into the running state.
- In running state, Pod has been bound to a node, and all of the containers have been created.
- If pods are terminated due to some reason, they may not get recreated if there are no controllers such as Deployments or Replica set.
- If the pod completes all of its tasks, it gets terminated and enters into the succeeded state.
- Pods that are in a pending state, it goes into the failed state due to a typo in the image name or image version.
- If the pod is in the unknown state, it means the pod’s status could not be obtained.
Taints and Tolerations
Taints and tolerations work together to ensure that pods are not scheduled onto inappropriate nodes. Taints are added to nodes, while tolerations are defined in the pod specification. When you taint a node, it will repel all the pods except those that have a toleration for that taint. A node can have one or many taints associated with it.
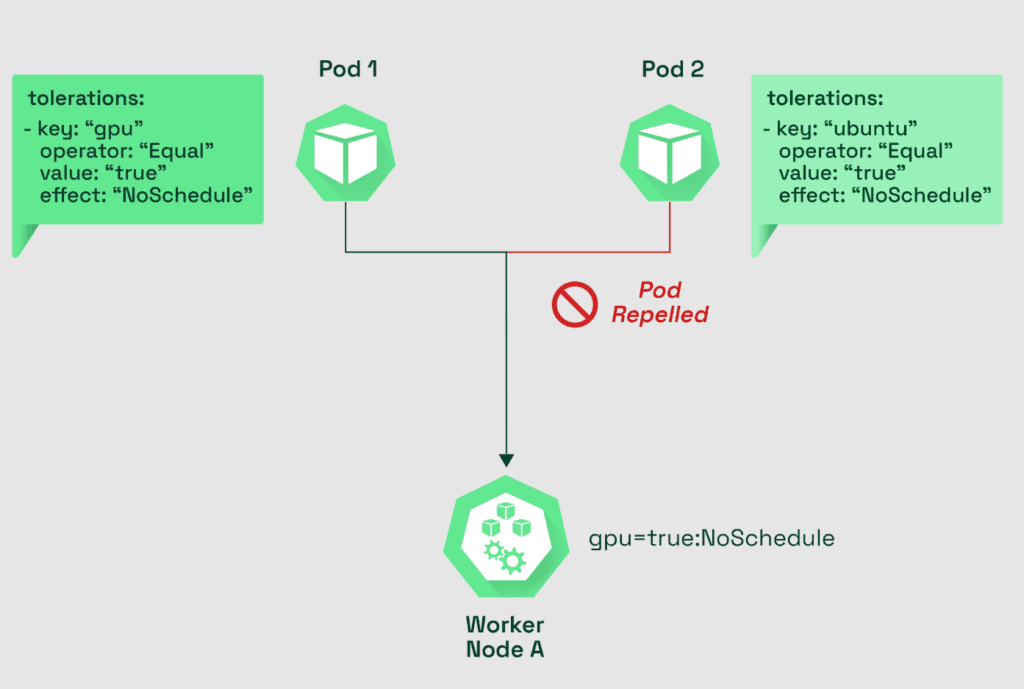
To add the taint
kubectl taint nodes node1 key1=value1:NoSchedulevim pod.ymlapiVersion: v1
kind: Pod
metadata:
name: nginx
labels:
env: test
spec:
containers:
- name: nginx
image: nginx
imagePullPolicy: IfNotPresent
tolerations:
- key: "key1"
operator: "Exists"
effect: "NoSchedule"
To remove the taint
kubectl taint nodes node1 key1=value1:NoSchedule-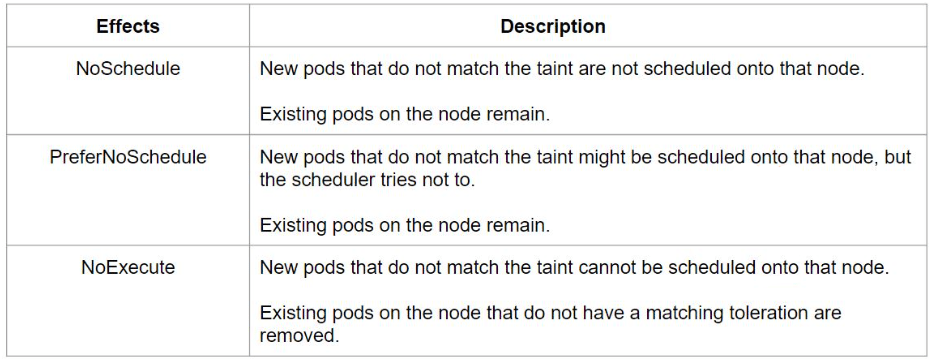
Network Policies
By default, pods are non-isolated and they accept traffic from any source.
A network policy is a specification of how groups of pods are allowed to communicate with each other and other network endpoints. The Network Policy resource in Kubernetes allows you to manage Layer 3 and 4 traffic on a pod level.
Note: By default, Kubernetes has no built-in capability to enforce the network policy. To enforce network policy, you must use a network plugin such as Calico, Weave, Cilium, Romana.
The Network Policy specifies 3 combinations you can use to manage traffic:
- Pod-to-pod traffic by identifying the pod using selectors (for example using pod labels)
- Traffic rules based on Namespace (for example pod from namespace 1 can access all pods in namespace 2)
- Rules based on IP blocks (taking into account that traffic to and from the node that the pod is running on is always allowed)

A Network Policy to deny all ingress and all egress traffic by default will look like this:
apiVersion: networking.k8s.io/v1
kind: NetworkPolicy
metadata:
  name: default-deny-all
spec:
  podSelector: {}
  policyTypes:
  - Ingress
  - Egress
Scenario 1: Pod should be isolated so that no communication happens
vim demo.ymlapiVersion: v1
kind: Pod
metadata:
name: testpod4
labels:
env: testing
spec:
containers:
- name: c00
image: httpd
ports:
- containerPort: 80kubectl apply -f demo.yml
kubectl get pods -o wide
ping 192.168.1.4
kubectl get pods --show-labelsapiVersion: networking.k8s.io/v1
kind: NetworkPolicy
metadata:
name: default-deny-pod
spec:
podSelector:
matchLabels:
env: testing
policyTypes:
- Ingresskubectl apply -f network-policy.yml
ping 192.168.1.4
kubectl exec -it testpod4 bash
apt-get update
apt-get install iputils-ping
ping google.comapiVersion: networking.k8s.io/v1
kind: NetworkPolicy
metadata:
name: default-deny-pod
spec:
podSelector:
matchLabels:
env: testing
policyTypes:
- Ingress
- Egresskubectl apply -f network-policy.yml
ping google.comapiVersion: networking.k8s.io/v1
kind: NetworkPolicy
metadata:
name: default-deny-pod
spec:
podSelector:
matchLabels:
env: testing
policyTypes:
- Ingress
ingress:
- from:
- podSelector:
matchLabels:
hello: satyamkubectl apply -f network-policy.yml
kubectl run busybox --rm -ti --labels="hello=satyam" --image=busybox:1.28 -- /bin/sh
ping 192.168.1.4Scenario 2:

apiVersion: networking.k8s.io/v1
kind: NetworkPolicy
metadata:
  name: db-network-policy
spec:
  podSelector:
    matchLabels:
      role: db-pod
  policyTypes:
  - Ingress
  - Egress
  ingress:
  - from:
    - podSelector:
        matchLabels:
          role: internal-db
      namespaceSelector:
        matchLabels:
          name: dev
    ports:
    - protocol: TCP
      port: 8080
  egress:
  - to:
    - ipBlock:
        cidr: 172.17.0.0/16
        except:
        - 172.17.1.0/24
    ports:
    - protocol: TCP
      port: 30000
      endPort: 32768
Service Accounts
Kubernetes Clusters have two categories of users:
- Normal Users
- Service Accounts
In the Kubernetes cluster, any processes or applications in the container which resides within the pod can access the cluster by getting authenticated by the API server, using a service account. For ex, an application like Prometheus accessing the cluster to monitor it is a type of service account. In simple words, Service Accounts allows the Pods to communicate with the API Server.

Note: When you create a pod, if you do not specify a service account, it is automatically assigned the default service account in the same namespace.
To check various application or processes which used the service account to communicate with k8s master node
kubectl get sa --all-namespacesTo list all service accounts
kubectl get saTo check the YAML file for the default Service account
kubectl get sa default -o yamlkubectl get secrets default-token -o yamlNote: When you create a Pod, each Pod is automatically assigned a default ServiceAccount named “default” unless a different ServiceAccount is specified. This default ServiceAccount is automatically mounted into the Pod at a specific path: /var/run/secrets/kubernetes.io/serviceaccount. This mount path is useful for applications running inside the Pod to interact with the Kubernetes API server and authenticate themselves using the credentials provided by the default ServiceAccount.
kubectl run demo-pod --image=nginx
kubectl describe pod demo-pod
kubectl cluster-info
kubectl exec -it demo-pod -- bash
cd /var/run/secrets/kubernetes.io/serviceaccount
ls
cat token
token=$(cat token)
echo $token
curl -k -H "Authorization: Bearer $token" url/api/v1
Note: When you create a cluster, Kubernetes automatically creates a ServiceAccount object named “default” for every namespace in your cluster.
Note: The default service accounts in each namespace get no permissions by default other than the default API discovery permissions that Kubernetes grants to all authenticated principals if RBAC is enabled.
To create new service account
kubectl create serviceaccount custom-token
kubectl get sa
To mount custom service account to pod
apiVersion: v1
kind: Pod
metadata:
  name: custom-pod
spec:
  serviceAccountName: custom-token
  containers:
  - name: demo-pod
    image: nginx
kubectl apply -f demo.yml
kubectl get pods
kubectl describe pod custom-pod
Security Contexts
When you run a container, it runs with the UID 0 (Administrative Privilege). In-case of container breakouts, an attacker can get root privileges to your entire system.
kubectl run busybox --image=busybox -it sh
ps
cd /tmp
touch test.txt
ls -l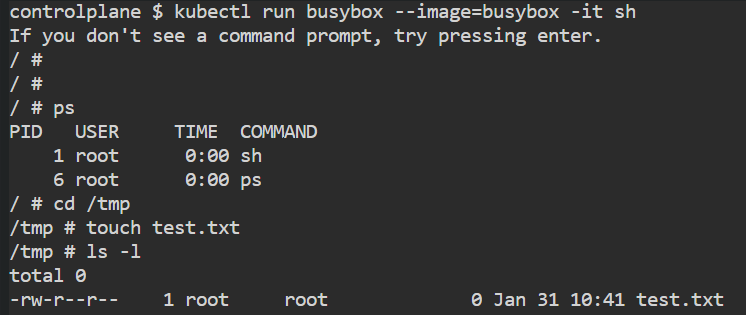
To avoid that, we can run pod and container with limited privilege user instead of the ROOT user.
The following are the three important permissions:
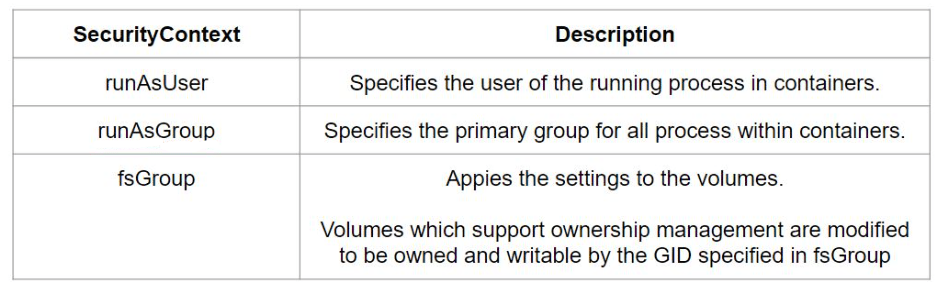
apiVersion: v1
kind: Pod
metadata:
  name: security-context-demo
spec:
  securityContext:
    runAsUser: 1000
    runAsGroup: 3000
  containers:
  - name: sec-ctx-demo
    image: busybox:1.28
    command: [ "sh", "-c", "sleep 1h" ]
kubectl apply -f https://k8s.io/examples/pods/security/security-context.yaml
kubectl exec -it security-context-demo -- sh
ps
cd /tmp
touch test.txt
ls -l
Helm
- Helm is a package manager for Kubernetes applications. It helps you manage the deployment, configuration, and upgrade of Kubernetes applications.
- Helm helps you manage K8s applications with helm charts which helps you define, install and upgrade even the most complex Kubernetes application.
- Helm charts can either be stored locally or fetched from remote chart repositories.
- Helm 3 has a client-only architecture. It operates similar to the Helm 2 client, but the client interacts directly with the Kubernetes API server. The in-cluster server
Tilleris now removed. - Helm charts are simply K8s YAML manifests combined into a single package that can be advertised to your K8s cluster.

Why Helm?
Writing and maintaining Kubernetes YAML manifest for all the required Kubernetes objects can be a time consuming and tedious task. Helm simplifies this process and create a single package that can be advertised to your cluster. Helm automatically maintains a database of all versions of your releases. So whenever something goes wrong during deployment, rolling back to the previous version is just one command away.
Helm charts
A Helm chart is a collection of pre-configured Kubernetes resources (such as Deployments, Services, ConfigMaps, etc.) packaged together for easy installation and management. Charts are organized into directories with specific structure and contain a Chart.yaml file that describes metadata about the chart.
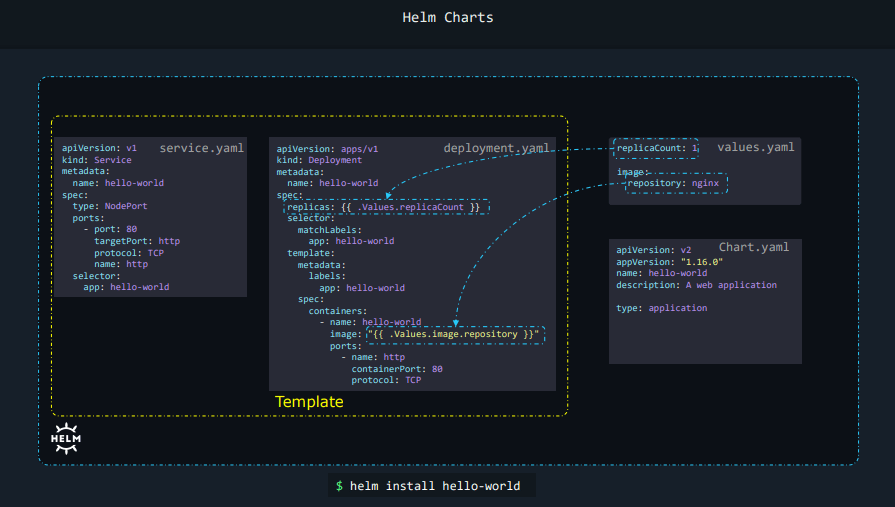
Charts can be customized by providing a values.yaml file. This file contains user-defined configuration values that are used in the chart’s templates.
Release: A release is an instance of a Helm chart installed in a Kubernetes cluster. It’s a specific deployment with a unique name and set of configuration values. You can manage releases using Helm commands, such as installing, upgrading, or deleting releases.
Repository: Helm charts are often distributed via Helm repositories. A Helm repository is a collection of charts hosted on a server accessible to the Helm client. You can add, update, and remove repositories to discover and install charts from various sources.
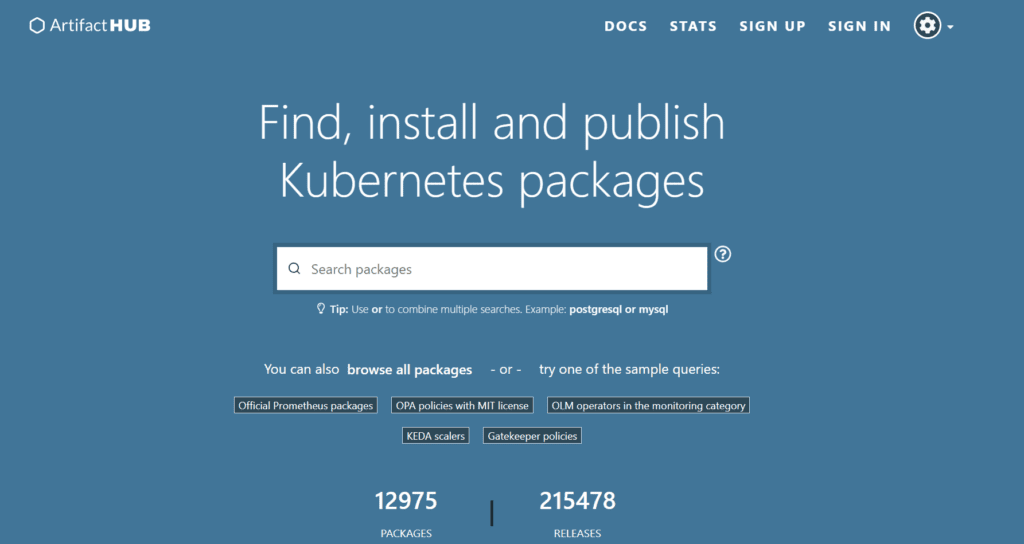
Important commands
helm repo add <Name> <URL>
helm repo add stable https://charts.helm.sh/stable
This command is used to add a Helm repository. https://charts.helm.sh/stable repository contains a collection of stable Helm charts that you can use to deploy various applications and services
helm repo listThe command “helm repo list” retrieves and displays a list of the Helm repositories that are currently configured on your system.
helm repo remove stableThis command is used to delete or remove the Helm repository named “stable” from your configuration. This means that you will no longer be able to access or install charts from that particular repository
helm repo updateThe helm repo update command is used to update the local cache of Helm charts from the configured Helm repositories. This command fetches the latest information about available charts and updates the local index to ensure you have the most up-to-date information when searching for and installing charts.
helm search repo jenkins
helm search hub wordpress
This command is used to search for Helm charts related to Jenkins in the available repositories
helm install [NAME] [CHART]
helm install testjenkins stable/jenkins
helm list
kubectl get all
This command is used to install the Jenkins application from the “stable” Helm repository
helm upgrade [NAME] [CHART]
helm history [NAME]
This command is used to upgrade an installed Helm chart
helm uninstall testjenkinsThis command is used to uninstall or delete the Jenkins application that was previously installed using Helm
helm install --dry-run testchart stable/tomcatThe “–dry-run” flag is used to perform a trial run of the installation without actually applying any changes to your cluster. This allows you to preview the installation process and ensure that everything is set up correctly before proceeding with the actual installation
helm lint nginx-chartThe helm lint command is used to check a Helm chart for issues and potential problems without actually installing or rendering it. It’s a helpful command to ensure that your Helm chart is well-formed and follows best practices before using it.
helm create helloworldThis command is used to create a new Helm chart named “helloworld.” This chart serves as a template for packaging and deploying a Kubernetes application or service.
Kubernetes Best Practices
- Use namespaces
- Use role-based access control
- Use readiness and liveness probes
- Use autoscaling
- Use resource requests and limits
- Use multiple nodes
- Use a cloud service
- Monitor your cluster resources and audit policy logs
- Use GitOps workflow
- Use a version control system
- Organize objects with labels
- Use declarative configuration
- Use Network policies and Firewall
- Use Helm
- Use Secrets and ConfigMaps
- Use monitoring (Prometheus and Grafana)
- Use Deployment, DaemonSet, or StatefulSet
Troubleshooting Kubernetes
To get detailed information about the overall health of your cluster, you can run:
kubectl get componentstatus
kubectl cluster-info
kubectl cluster-info dump
kubectl get nodes
kubectl describe node kube-worker-1
Note: Please keep in mind that these examples are written for a system that runs systemd as the service manager. If you are using other service manager, the command may different.
Use journalctl to view logs
To view all logs:
journalctlTo view logs for a specific unit
journalctl -u kubelet
journalctl -u kube-apiserver
journalctl -u kube-controller-manager
journalctl -u kube-scheduler
journalctl -f -u kube-apiserver
To view logs in reverse order (newest first)
journalctl -rTo view logs since a certain time
journalctl --since "2023-01-10 21:30:01" --until "2023-01-10 21:30:05" -u kubeletTo view the logs for a specific pod in a namespace
journalctl -u kubelet -n kube-system -f | grep <pod-name>To view the logs for a specific node
journalctl -u kubelet -n kube-system -f | grep <node-name>Pod Level Logging
kubectl logs <pod-name>
kubectl logs <pod-name> -c <container-name>
kubectl logs -f <pod-name>
kubectl logs --previous <pod-name>
Logging Best Practices
- Centralize your logs
- Structured logging: Ensure your applications and systems are logging in a structured format (like JSON), making logs easier to query and analyze.
- Log levels: Use appropriate logging levels (INFO, WARN, ERROR, etc).
- Log Retention and Rotation: Be aware of how long your logs are retained, and implement a log rotation policy to prevent storage issues.
Draining Worker Nodes
In Kubernetes, before you perform maintenance on the node (e.g. kernel upgrade, hardware maintenance, etc.), sometimes it is needed to remove a node from service. To do this, one can DRAIN the node. In this process, containers running on the node (to be drained) will be gracefully terminated & potentially rescheduled on another node. Draining can be performed on a Control Plane node as well as a Worker node.
kubectl get pods -o wide
kubectl get nodes
kubectl cordon <node name>
kubectl drain --ignore-daemonsets <node name>
kubectl uncordon <node name>
kubectl get nodes
Note: ‘- -ignore-daemonsets’ is used because there may be some daemonset pods that are tied to the node, so user may want to ignore them while executing the draining
Note: Static Pods will be terminated
Taint Based Evictions
We know that the NoExecute effect can be used to evict pods within a node so the node controller will automatically taint nodes if certain conditions are true, such as node being unreachable, network unavailability, memory or disk pressure, etc. When a default condition occurs, the node controller or kubelet will add the relevant taints to the nodes with the NoExecute effect.
However, we can modify the default behavior by creating custom tolerations. For example, Kubernetes automatically adds tolerations for node.kubernetes.io/not-ready and node.kubernetes.io/unreachable with tolerationSeconds set for 300 (5 minutes) by default. However, we can change this behavior by explicitly specifying toleration for these node conditions within the pod.
For example, the configuration below will override the default eviction behavior and allow the pod to remain within the node for an hour before eviction.
tolerations:
- key: "node.kubernetes.io/unreachable"
  operator: "Exists"
  value: "NoExecute"
  tolerationSeconds: 3600
kubectl get nodes
kubectl run nginx --image=nginx
kubectl get pods -o wide
// Log in to worker node in which pod is running
systemctl status kubelet
systemctl stop kubelet
kubectl get nodes (Grace period = 40sec)
kubectl get nodes
kubectl get pods -o wide (300s)
kubectl describe node <worker_node>
kubectl get pods -o wide (300s)Even though the server is in the shutdown state, your pod for the 300 seconds (five minutes), the status would not be updated and this can be a problem in many of the scenarios. So what you want is you do not want to wait for five minutes. You only might want to wait for two seconds. So that is something that you can configure as part of the pod spec.
apiVersion: v1
kind: Pod
metadata:
  name: nginxwebserver
spec:
  containers:
  -  image: nginx
     name: democontainer
  tolerations:
    - key: "node.kubernetes.io/not-ready"
      operator: "Exists"
      effect: "NoExecute"
      tolerationSeconds: 2
    - key: node.kubernetes.io/unreachable
      operator: Exists
      effect: NoExecute
      tolerationSeconds: 2
Version Skew Policy
The Kubernetes project maintains release branches for the most recent three minor releases (1.29, 1.28, 1.27). Kubernetes versions are expressed as x.y.z, where x is the major version, y is the minor version, and z is the patch version.
For more details: Click here