Step 1:
Launch an Ubuntu(22.04) t2.large instance

Step 2:
Install Jenkins on it.
To install Jenkins : Click here
Once Jenkins is up and running, you can access it by navigating to your EC2 instance’s public IP address followed by port 8080.
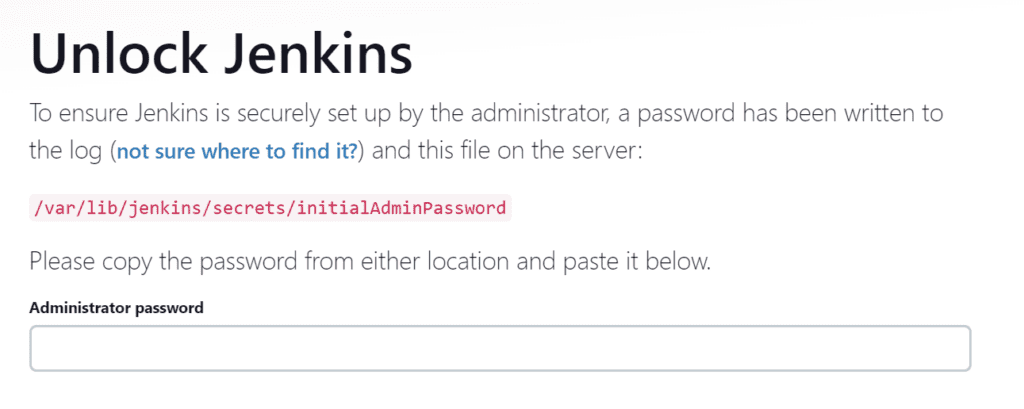
To get the password, type the following command,
sudo cat /var/lib/jenkins/secrets/initialAdminPasswordStep 3:
Install Docker on server
sudo apt install docker.io
sudo usermod -a -G docker $USER
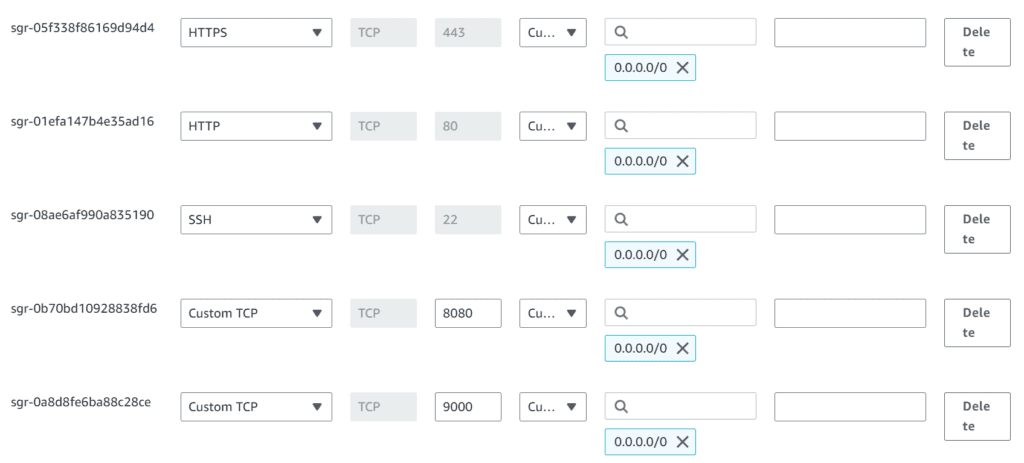
sudo rebootNote: After the docker installation, we create a SonarQube container (Remember to add 9000 ports in the security group)
Step 4:
Install Trivy
vi trivy.shsudo apt-get install wget apt-transport-https gnupg lsb-release -y
wget -qO - https://aquasecurity.github.io/trivy-repo/deb/public.key | gpg --dearmor | sudo tee /usr/share/keyrings/trivy.gpg > /dev/null
echo "deb [signed-by=/usr/share/keyrings/trivy.gpg] https://aquasecurity.github.io/trivy-repo/deb $(lsb_release -sc) main" | sudo tee -a /etc/apt/sources.list.d/trivy.list
sudo apt-get update
sudo apt-get install trivy -ysudo chmod +x trivy.sh
sh trivy.shStep 5:
After the docker installation, we create a SonarQube container
docker run -d --name sonar -p 9000:9000 sonarqube:lts-community
docker ps
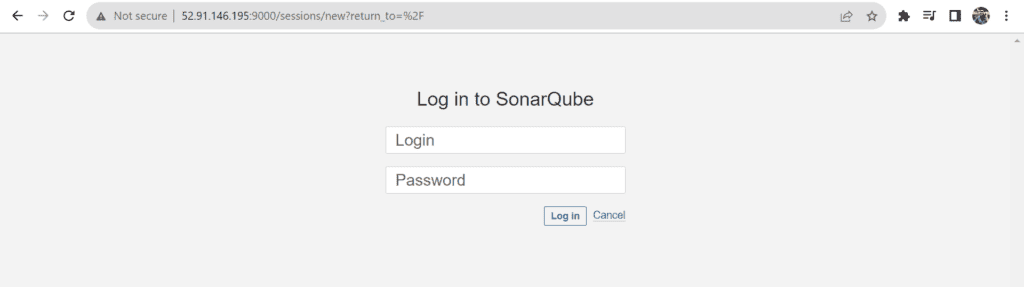
Username -> admin
Password -> admin
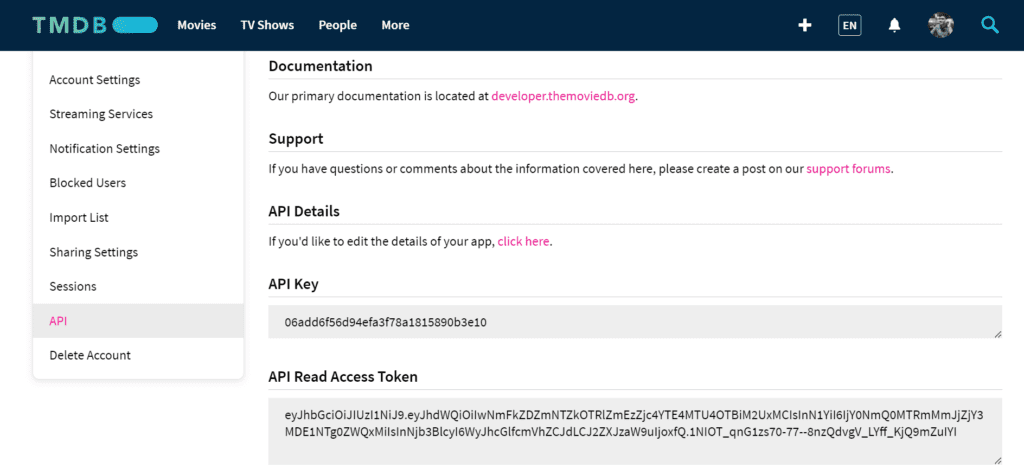
Step 6:
Create a TMDB API Key
Step 7:
Launch one more Ubuntu(22.04) t2.medium instance

Step 8:
Install Prometheus on the new server
First of all, let’s create a dedicated Linux user for Prometheus. Having individual users for each service serves two main purposes:
- It is a security measure to reduce the impact in case of an incident with the service.
- It simplifies administration as it becomes easier to track down what resources belong to which service.
To create a system user or system account, run the following command:
sudo useradd \
    --system \
    --no-create-home \
    --shell /bin/false prometheus
You can use wget command to download Prometheus.
wget https://github.com/prometheus/prometheus/releases/download/v2.47.1/prometheus-2.47.1.linux-amd64.tar.gz
ls
tar -xvf prometheus-2.47.1.linux-amd64.tar.gz
sudo mkdir -p /data /etc/prometheus
cd prometheus-2.47.1.linux-amd64/
sudo mv prometheus promtool /usr/local/bin/
sudo mv consoles/ console_libraries/ /etc/prometheus/
sudo mv prometheus.yml /etc/prometheus/prometheus.yml
sudo chown -R prometheus:prometheus /etc/prometheus/ /data/
cd ..
rm -rf prometheus-2.47.1.linux-amd64.tar.gz
prometheus --version
sudo vim /etc/systemd/system/prometheus.service
[Unit]
Description=Prometheus
Wants=network-online.target
After=network-online.target

StartLimitIntervalSec=500
StartLimitBurst=5

[Service]
User=prometheus
Group=prometheus
Type=simple
Restart=on-failure
RestartSec=5s
ExecStart=/usr/local/bin/prometheus \
  --config.file=/etc/prometheus/prometheus.yml \
  --storage.tsdb.path=/data \
  --web.console.templates=/etc/prometheus/consoles \
  --web.console.libraries=/etc/prometheus/console_libraries \
  --web.listen-address=0.0.0.0:9090 \
  --web.enable-lifecycle

[Install]
WantedBy=multi-user.target
sudo systemctl enable prometheus
sudo systemctl start prometheus
sudo systemctl status prometheus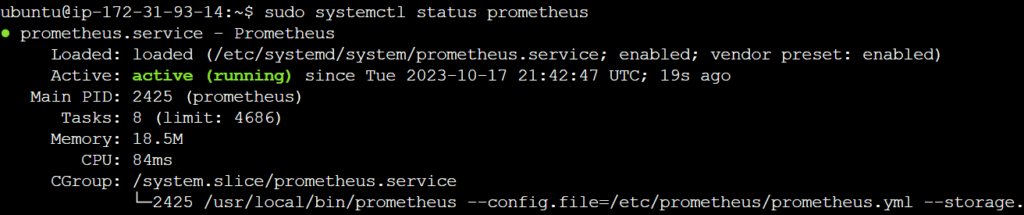
Suppose you encounter any issues with Prometheus or are unable to start it. The easiest way to find the problem is to use the journalctl command and search for errors.
journalctl -u prometheus -f --no-pager
Once Prometheus is up and running, you can access it by navigating to your EC2 instance’s public IP address followed by port 9090.
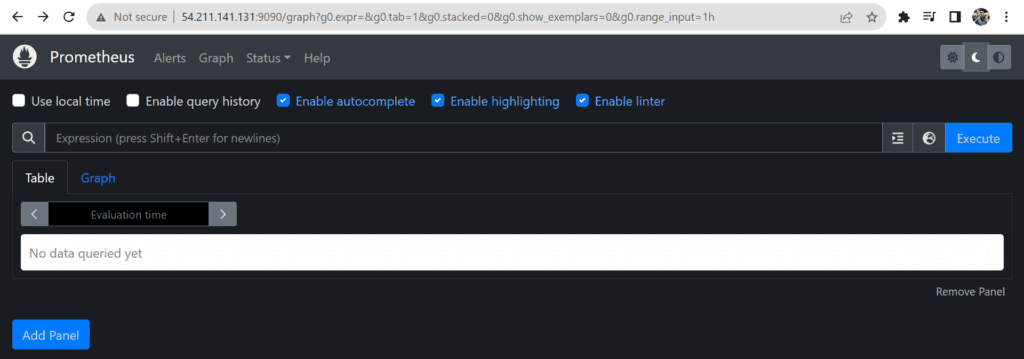
If you go to targets, you should see only one Prometheus target. It scrapes itself every 15 seconds by default.
Step 9:
Install Node Exporter on the new server (Prometheus-Grafana server)
Now, we’re going to set up and configure Node Exporter to collect Linux system metrics like CPU load and disk I/O. Node Exporter will expose these as Prometheus-style metrics.
sudo useradd \
    --system \
    --no-create-home \
    --shell /bin/false node_exporter
Use the wget command to download the binary
wget https://github.com/prometheus/node_exporter/releases/download/v1.6.1/node_exporter-1.6.1.linux-amd64.tar.gz
ls
tar -xvf node_exporter-1.6.1.linux-amd64.tar.gz
sudo mv \
  node_exporter-1.6.1.linux-amd64/node_exporter \
  /usr/local/bin/
rm -rf node_exporter*
node_exporter --version
sudo vim /etc/systemd/system/node_exporter.service
[Unit]
Description=Node Exporter
Wants=network-online.target
After=network-online.target

StartLimitIntervalSec=500
StartLimitBurst=5

[Service]
User=node_exporter
Group=node_exporter
Type=simple
Restart=on-failure
RestartSec=5s
ExecStart=/usr/local/bin/node_exporter \
    --collector.logind

[Install]
WantedBy=multi-user.target
sudo systemctl enable node_exporter
sudo systemctl start node_exporter
sudo systemctl status node_exporter
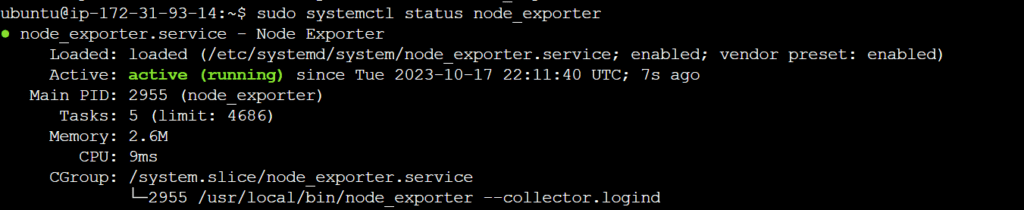
If you have any issues, check logs with journalctl
journalctl -u node_exporter -f --no-pager
Step 10:
At this point, we have only a single target in our Prometheus. There are many different service discovery mechanisms built into Prometheus. For example, Prometheus can dynamically discover targets in AWS, GCP, and other clouds based on the labels. For this blog, let’s keep it simple and keep adding static targets.
To create a static target, you need to add job_name with static_configs.
sudo vim /etc/prometheus/prometheus.yml
- job_name: node_export
    static_configs:
      - targets: ["localhost:9100"]
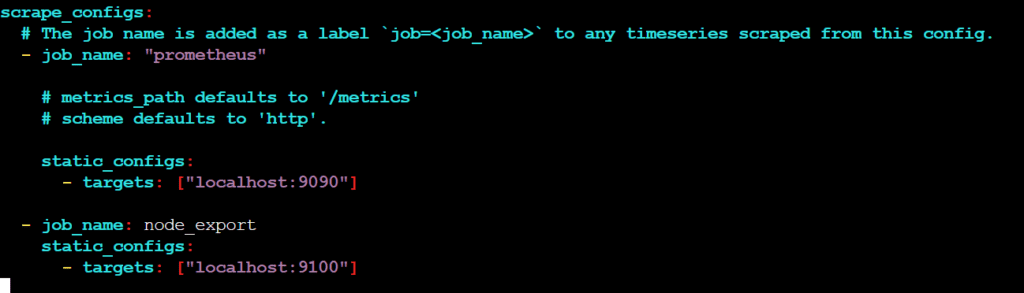
By default, Node Exporter will be exposed on port 9100
Since we enabled lifecycle management via API calls, we can reload the Prometheus config without restarting the service and causing downtime. Before, restarting check if the config is valid.
promtool check config /etc/prometheus/prometheus.yml

Then, you can use a POST request to reload the config.
curl -X POST http://localhost:9090/-/reload
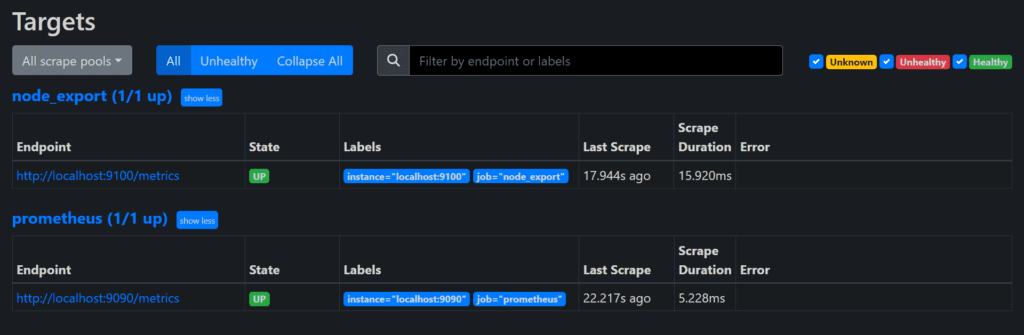
Check the targets section
Step 11:
Install Grafana on the new server (Prometheus-Grafana server)
First, let’s make sure that all the dependencies are installed.
sudo apt-get install -y apt-transport-https software-properties-common
wget -q -O - https://packages.grafana.com/gpg.key | sudo apt-key add -
echo "deb https://packages.grafana.com/oss/deb stable main" | sudo tee -a /etc/apt/sources.list.d/grafana.list
sudo apt-get update
sudo apt-get -y install grafana
sudo systemctl enable grafana-server
sudo systemctl start grafana-server

sudo systemctl status grafana-server
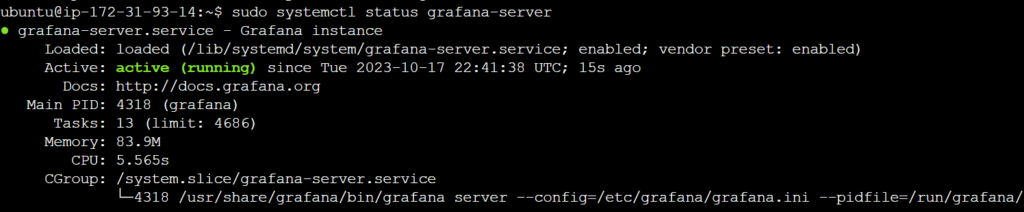
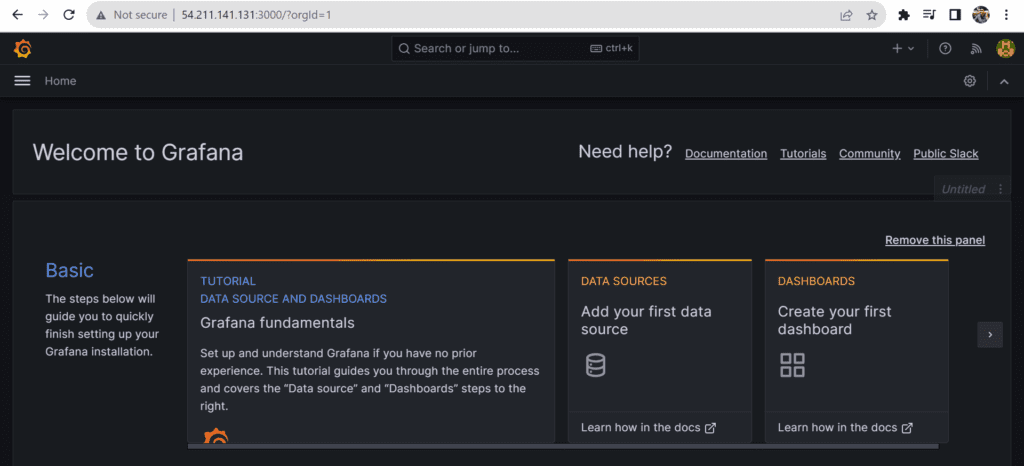
Once Grafana is up and running, you can access it by navigating to your EC2 instance’s public IP address followed by port 3000.
username – admin
password – admin
Step 12
To visualize metrics, you need to add a data source first. Click Add data source and select Prometheus.
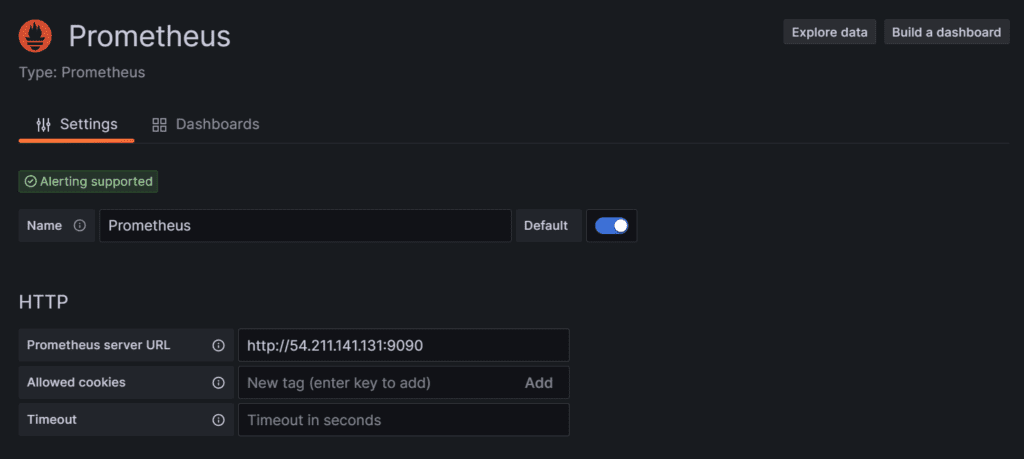
Click on Save and Test.
Let’s add Dashboard for a better view
Click on Import Dashboard paste this code 1860 and click on load
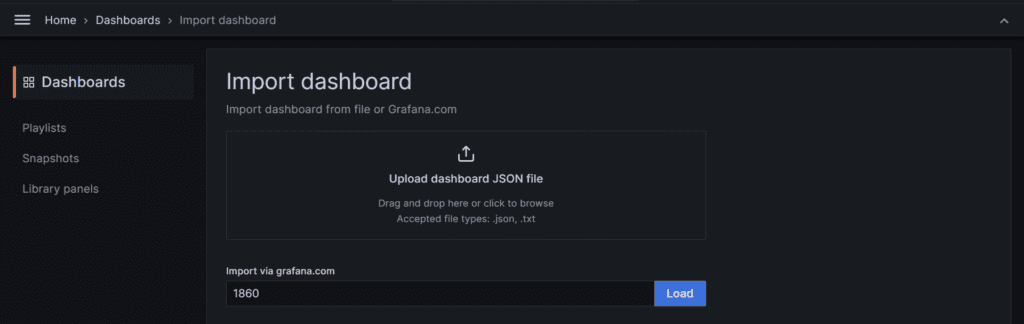
Select the Datasource and click on Import
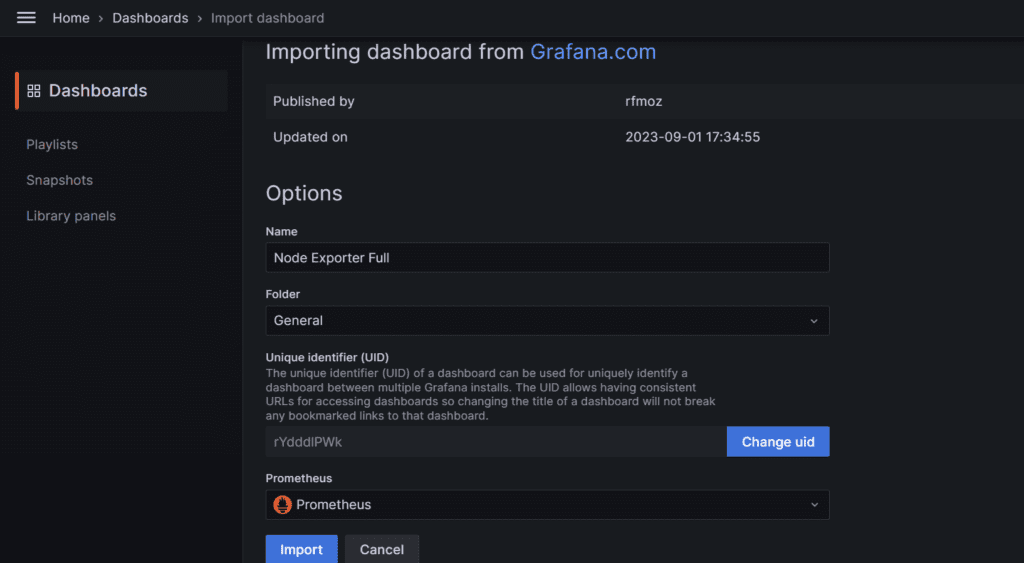
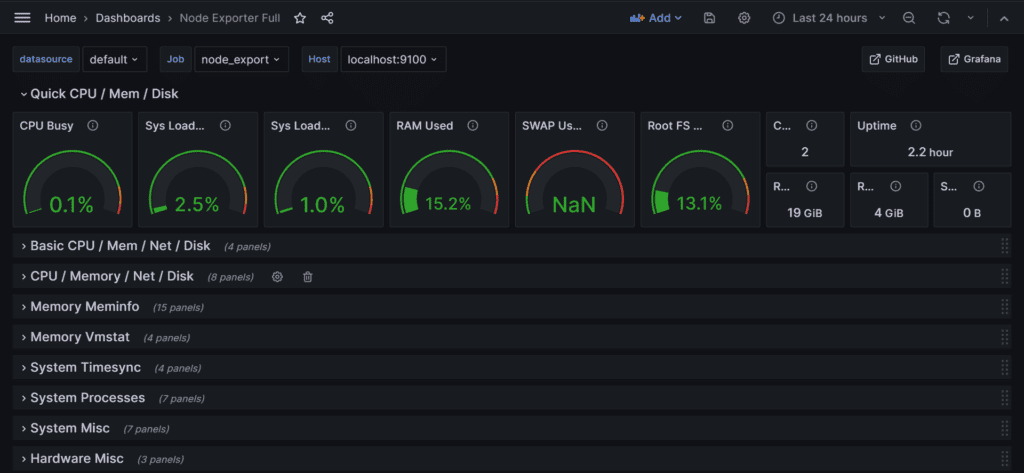
You will see this output
Step 13:
Install the Prometheus Plugin and Integrate it with the Prometheus server
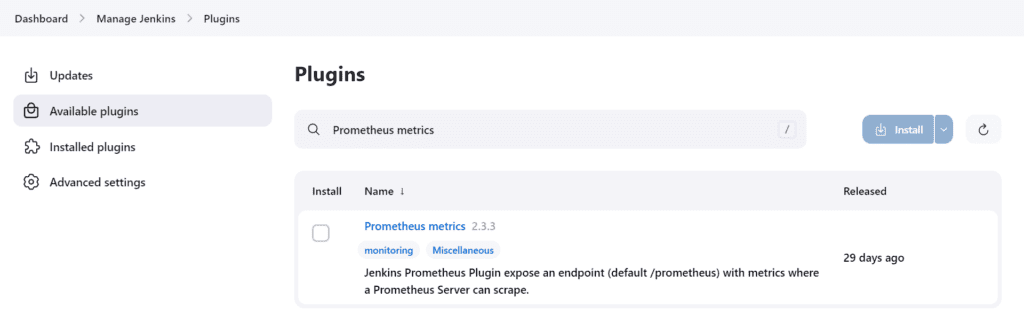
Once that is done you will Prometheus is set to /Prometheus path in system configurations
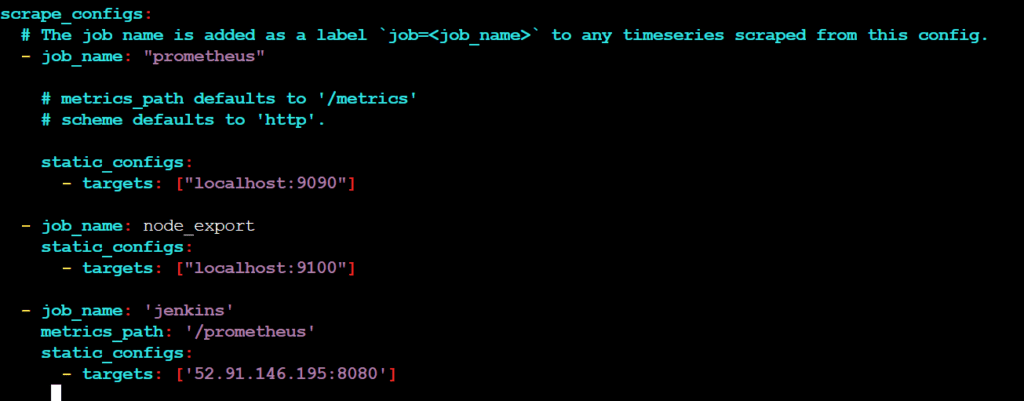
sudo vim /etc/prometheus/prometheus.yml
  - job_name: 'jenkins'
    metrics_path: '/prometheus'
    static_configs:
      - targets: ['<jenkins-ip>:8080']
Before, restarting check if the config is valid.
promtool check config /etc/prometheus/prometheus.yml
curl -X POST http://localhost:9090/-/reload
Check the targets section
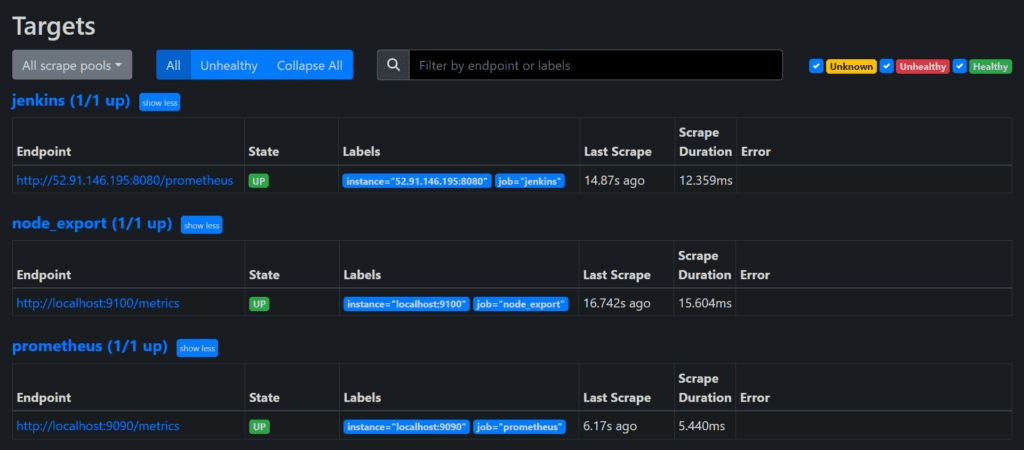
Step 14:
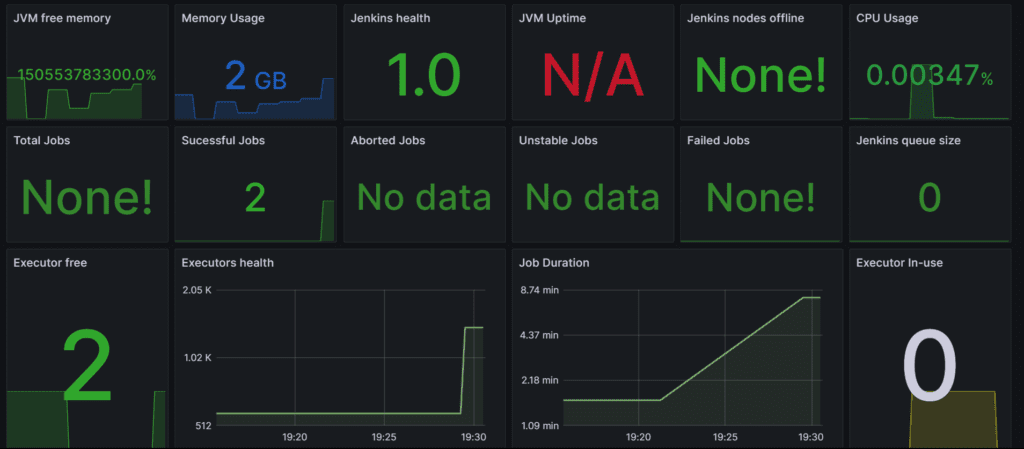
Let’s add Dashboard for a better view in Grafana
Click On Dashboard -> New -> Import Dashboard
Use Id 9964 and click on load.
Select the data source and click on Import
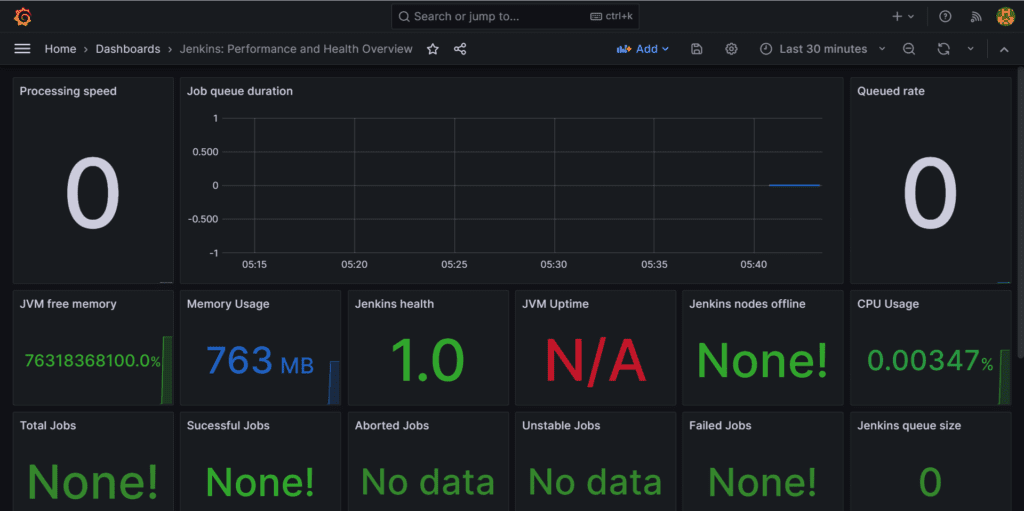
Step 15:
Email Integration With Jenkins
Go to your Gmail and click on your profile. Then click on Manage Your Google Account -> click on the security tab on the left side panel.
Note: Make sure 2-step verification should be enabled
Search for the app in the search bar you will get app passwords like the below image.

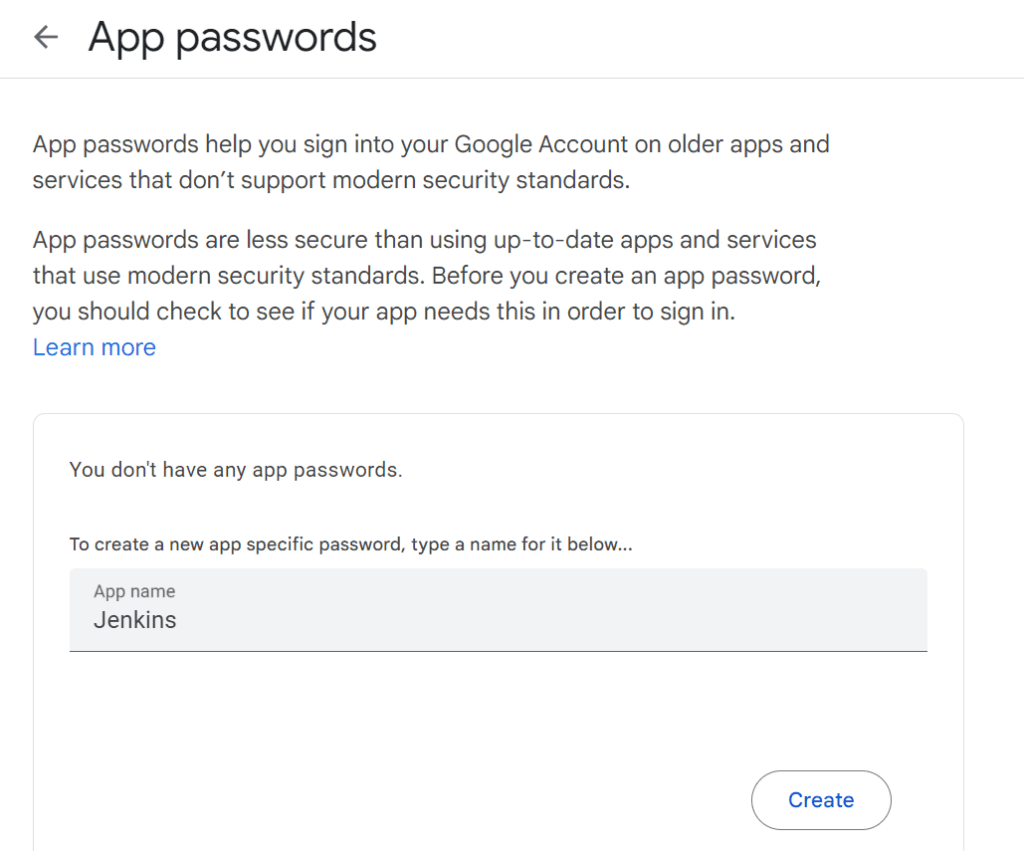
Then click Create and copy the password
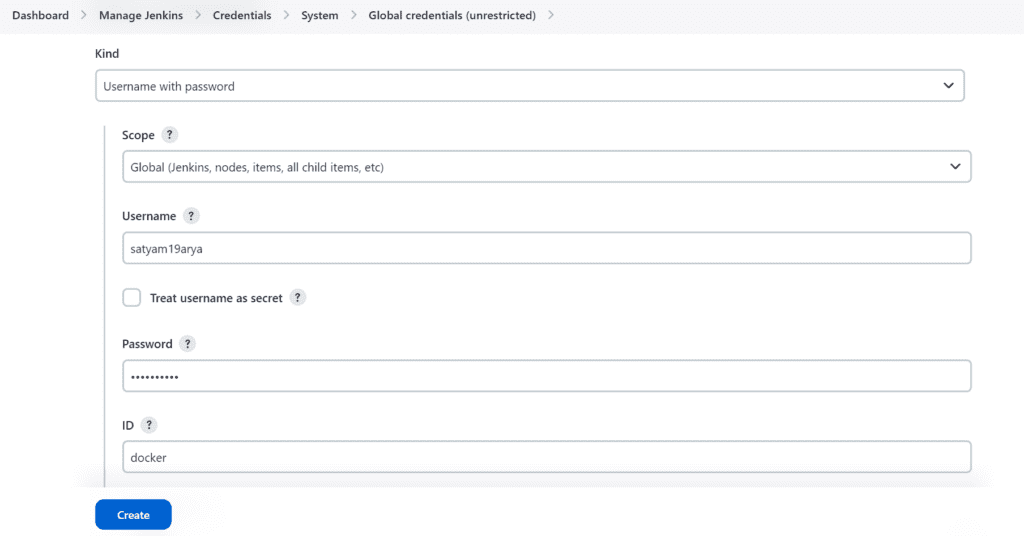
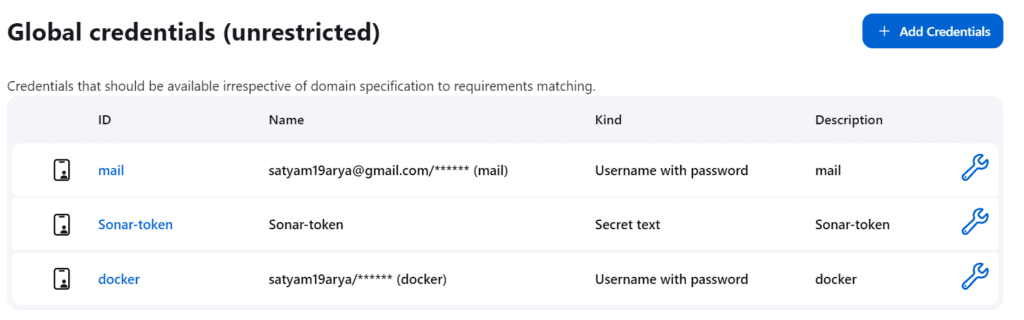
Now go to Manage Jenkins -> Credentials -> global -> Add credentials

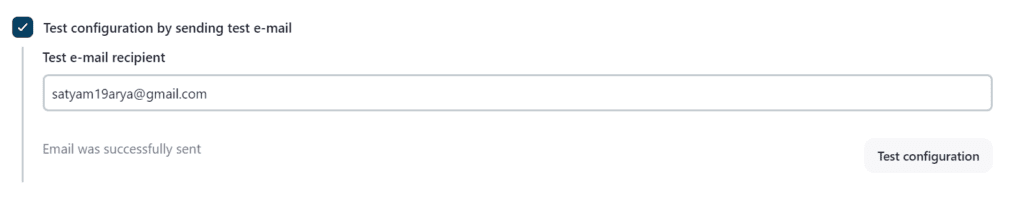
Now go to Manage Jenkins -> System and under the E-mail Notification section configure the details as shown in the below image
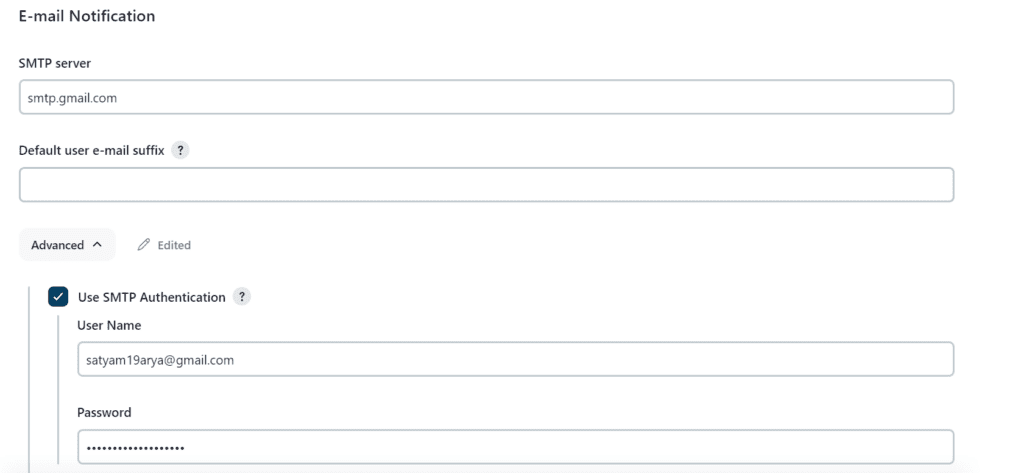
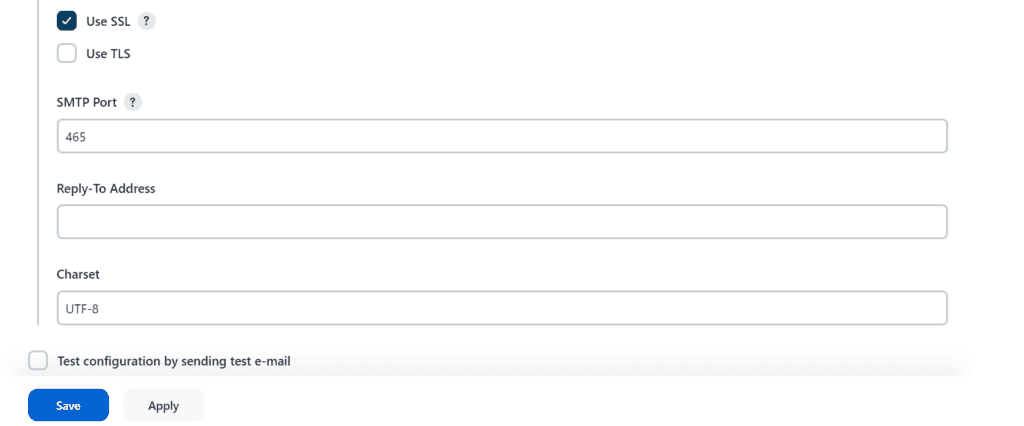
Click on Apply and save.
Now under the Extended E-mail Notification section configure the details as shown in the below images
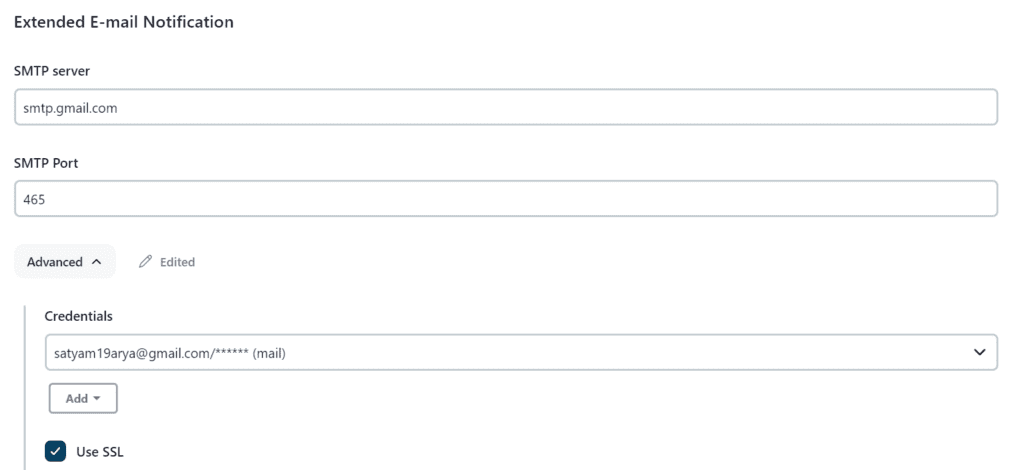
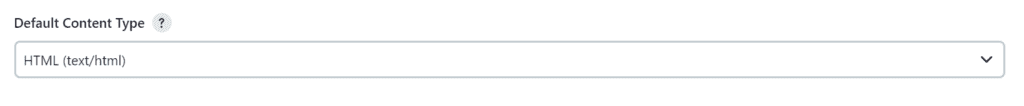
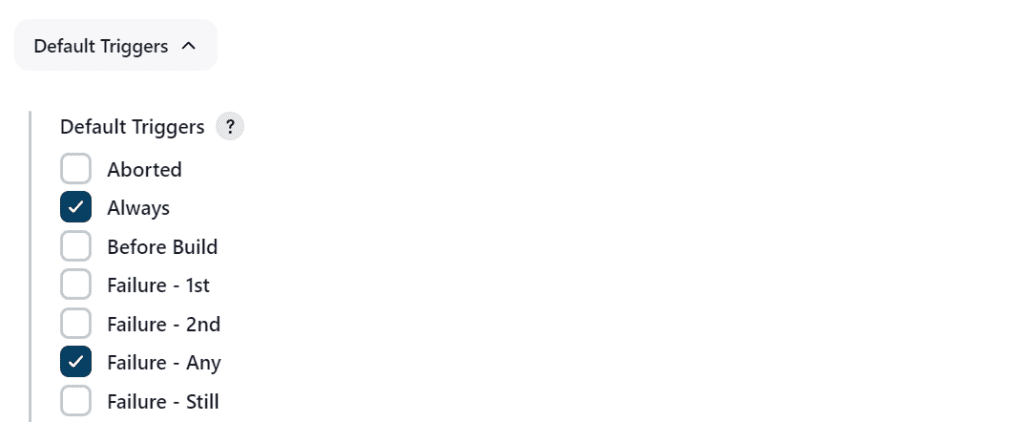
Click on Apply and save.
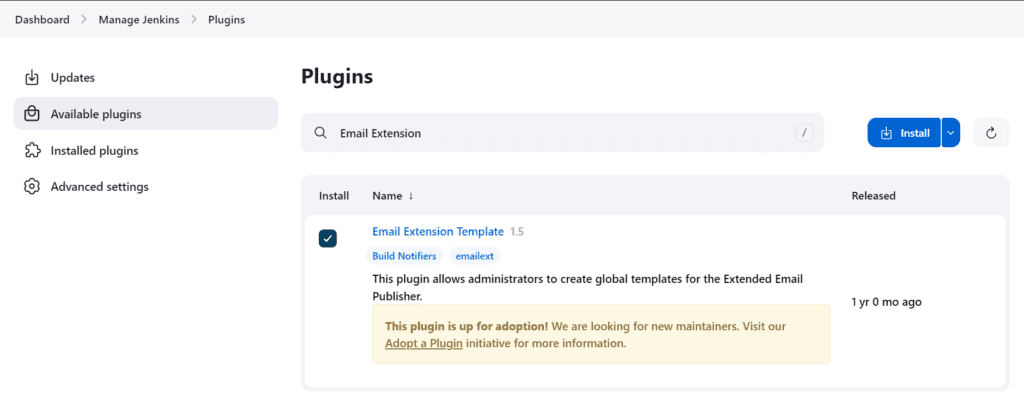
Step 16:
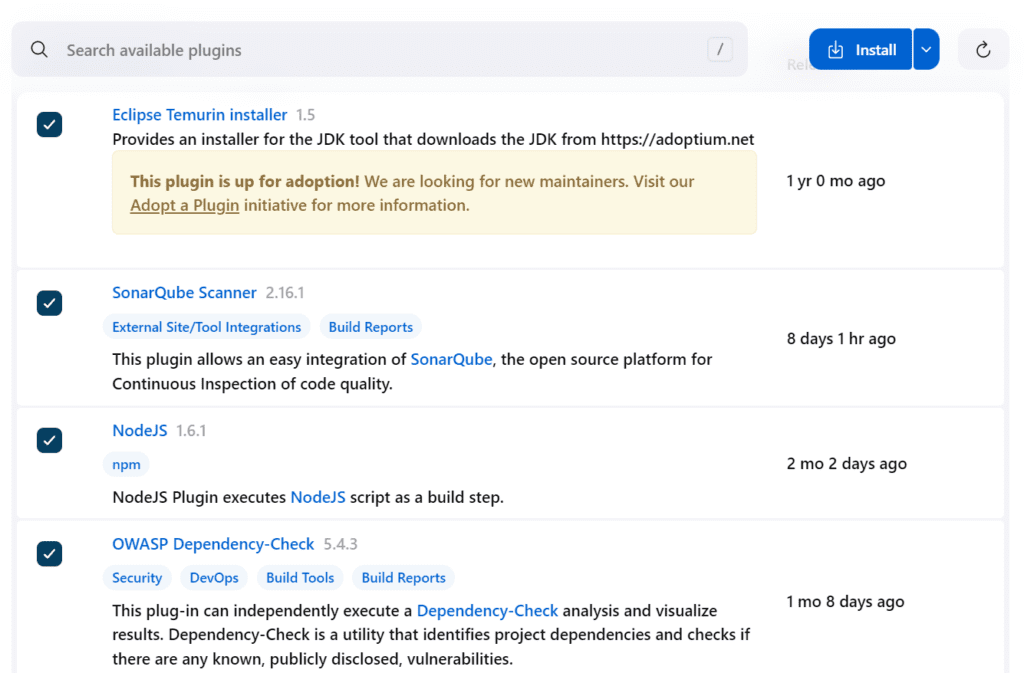
Install Plugins -> Eclipse Temurin Installer, SonarQube Scanner, NodeJS, OWASP Dependency-Check
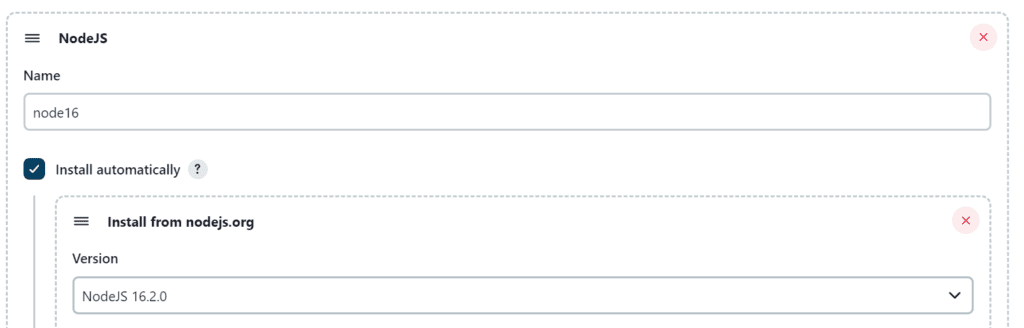
Step 17:
Configure Java and Nodejs in Global Tool Configuration
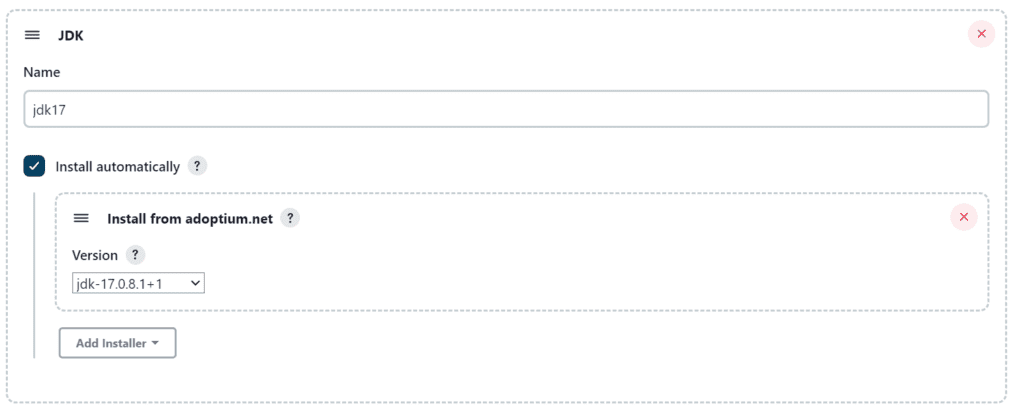
Click on Apply and Save.
Step 18:
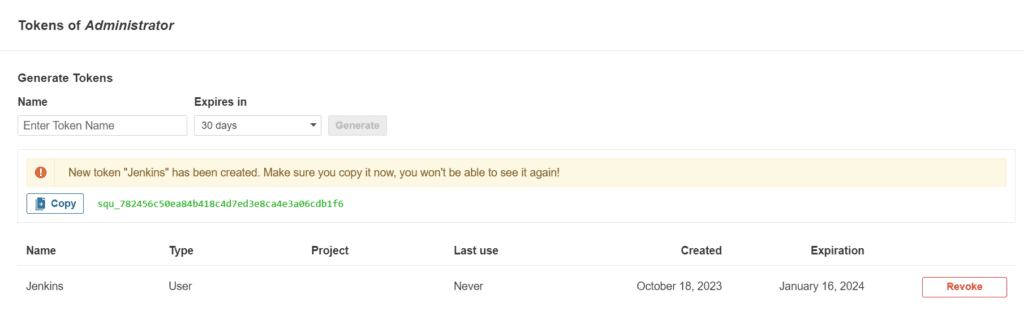
Configure SonarQube Server in Manage Jenkins
Click on Administration → Security → Users → Click on Tokens and Update Token → Give it a name → and click on Generate Token
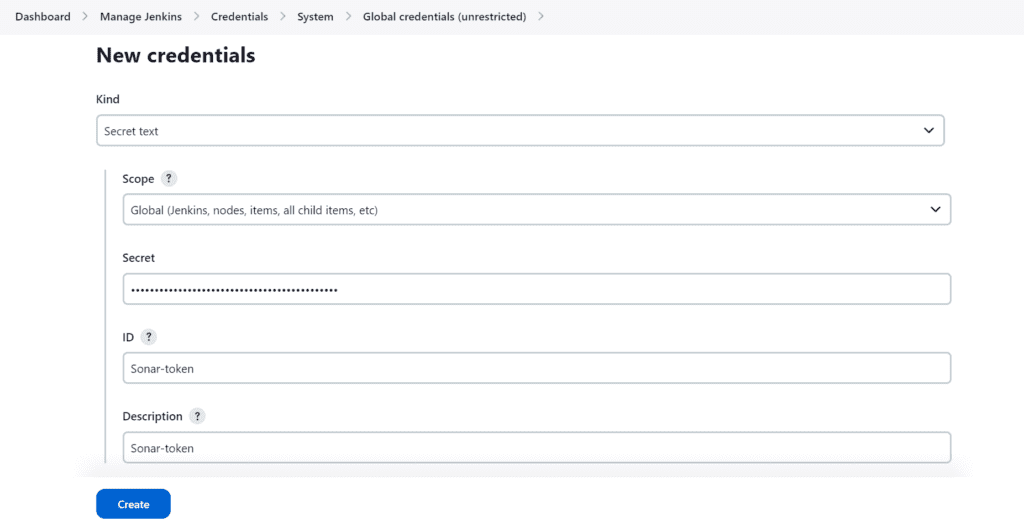
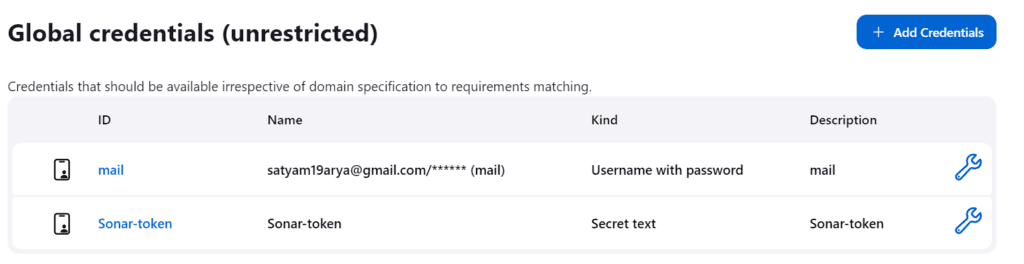
Goto Jenkins Dashboard → Manage Jenkins → Credentials → Secret Text.
Now, go to Dashboard → Manage Jenkins → System
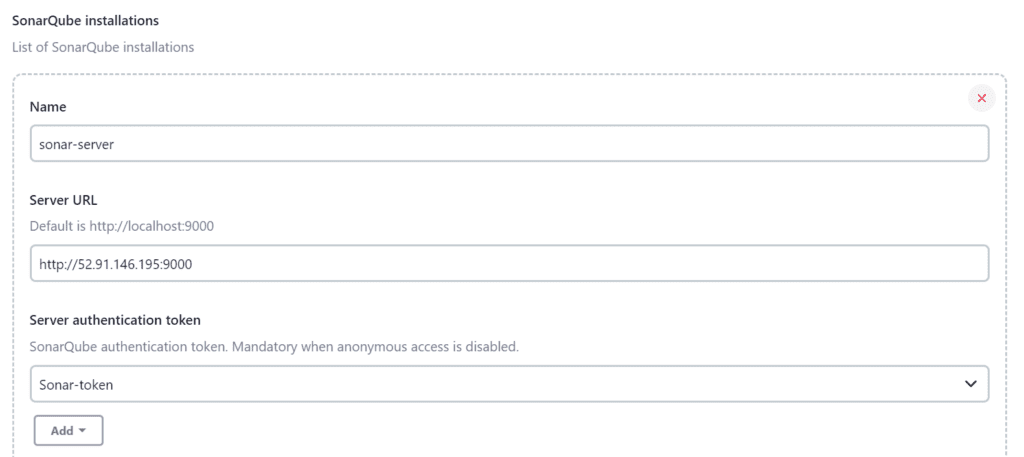
Click on Apply and Save
Now, We will install a sonar scanner in the tools
Goto Jenkins Dashboard → Manage Jenkins → Tools
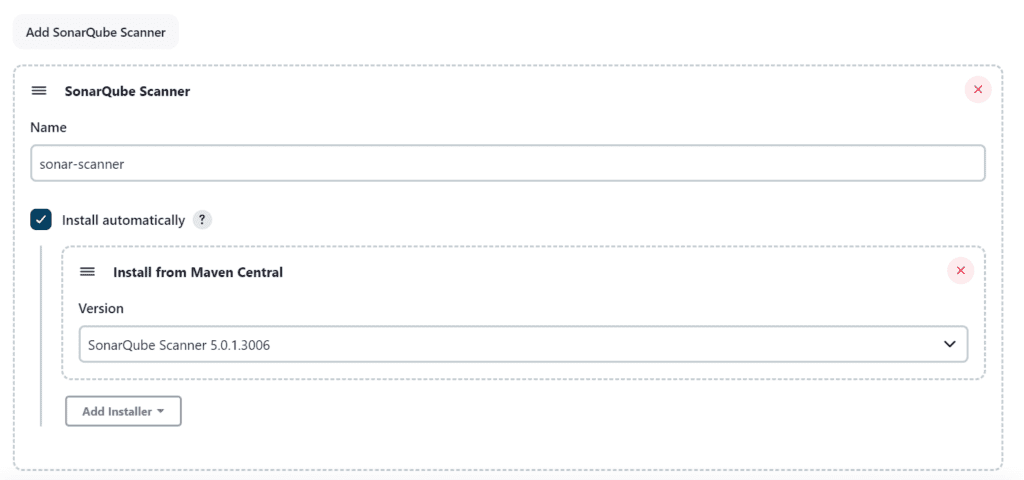
Click on Apply and Save.
Goto SonarQube -> Administration -> Configuration -> Webhooks
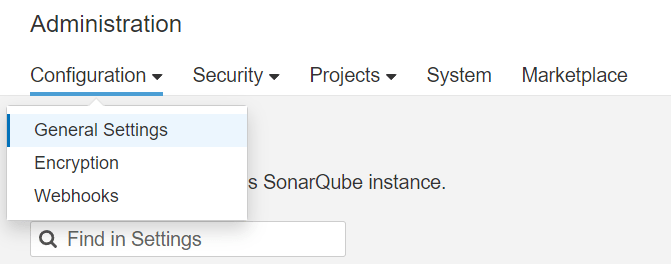
Click on Create

Click on Create
Step 19:
Create a Job
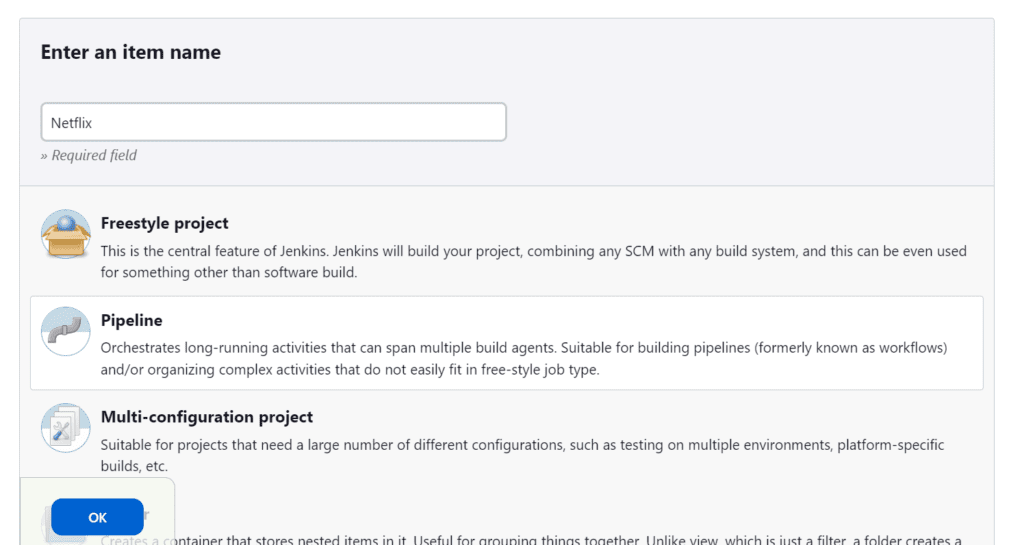
Add Description
Select Discard old builds
Add the script in our Pipeline Script
pipeline{
    agent any
    tools{
        jdk 'jdk17'
        nodejs 'node16'
    }
    environment {
        SCANNER_HOME=tool 'sonar-scanner'
    }
    stages {
        stage('clean workspace'){
            steps{
                cleanWs()
            }
        }
        stage('Checkout from Git'){
            steps{
                git branch: 'main', url: 'https://github.com/Aj7Ay/Netflix-clone.git'
            }
        }
        stage("Sonarqube Analysis "){
            steps{
                withSonarQubeEnv('sonar-server') {
                    sh ''' $SCANNER_HOME/bin/sonar-scanner -Dsonar.projectName=Netflix \
                    -Dsonar.projectKey=Netflix '''
                }
            }
        }
        stage("quality gate"){
           steps {
                script {
                    waitForQualityGate abortPipeline: false, credentialsId: 'Sonar-token'
                }
            }
        }
        stage('Install Dependencies') {
            steps {
                sh "npm install"
            }
        }
    }
    post {
     always {
        emailext attachLog: true,
            subject: "'${currentBuild.result}'",
            body: "Project: ${env.JOB_NAME}<br/>" +
                "Build Number: ${env.BUILD_NUMBER}<br/>" +
                "URL: ${env.BUILD_URL}<br/>",
            to: 'satyam19arya@gmail.com',
            attachmentsPattern: 'trivyfs.txt,trivyimage.txt'
        }
    }
}
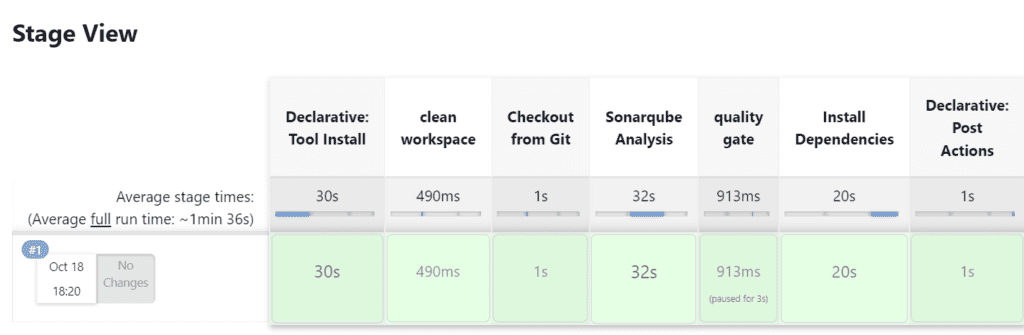
Click on Build now, you will see the stage view like this
To see the report, you can go to SonarQube Server and go to Projects
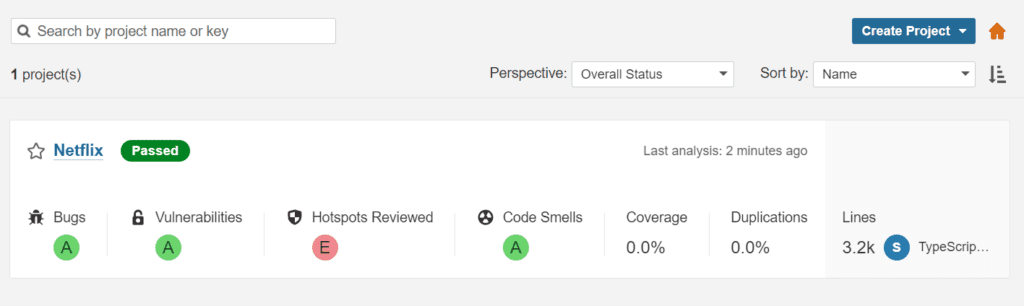
You can see the report has been generated and the status shows as passed. You can see that there are 3.2k lines it scanned. To see a detailed report, you can go to issues.
Step 20:
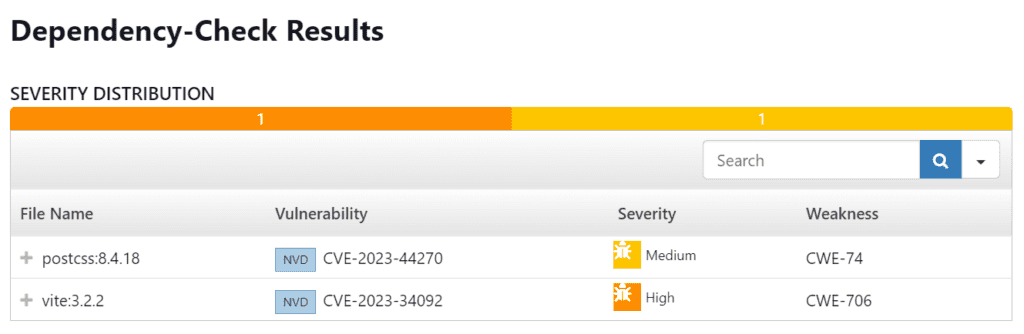
Configure OWASP Dependency Check Plugins
Goto Dashboard → Manage Jenkins → Tools
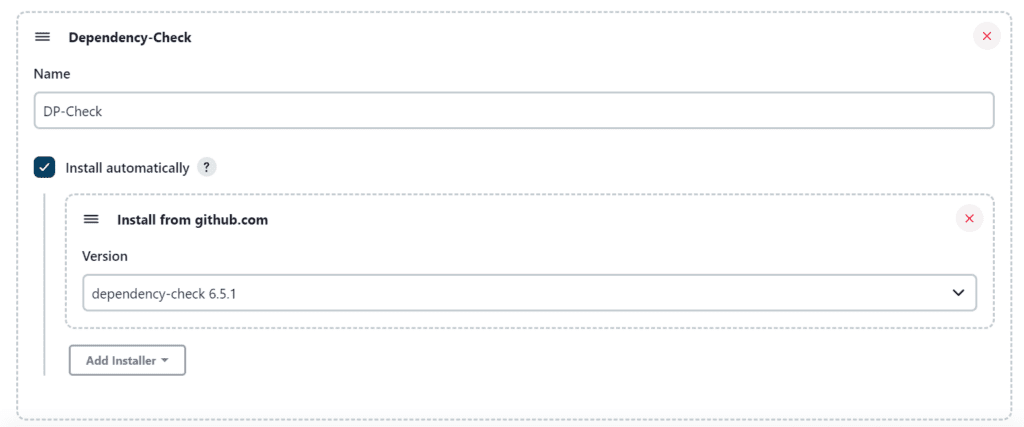
Click on Apply and Save
Now go configure → Pipeline and add this stage to your pipeline and build.
pipeline{
agent any
tools{
jdk 'jdk17'
nodejs 'node16'
}
environment {
SCANNER_HOME=tool 'sonar-scanner'
}
stages {
stage('clean workspace'){
steps{
cleanWs()
}
}
stage('Checkout from Git'){
steps{
git branch: 'main', url: 'https://github.com/Aj7Ay/Netflix-clone.git'
}
}
stage("Sonarqube Analysis "){
steps{
withSonarQubeEnv('sonar-server') {
sh ''' $SCANNER_HOME/bin/sonar-scanner -Dsonar.projectName=Netflix \
-Dsonar.projectKey=Netflix '''
}
}
}
stage("quality gate"){
steps {
script {
waitForQualityGate abortPipeline: false, credentialsId: 'Sonar-token'
}
}
}
stage('Install Dependencies') {
steps {
sh "npm install"
}
}
stage('OWASP FS SCAN') {
steps {
dependencyCheck additionalArguments: '--scan ./ --disableYarnAudit --disableNodeAudit', odcInstallation: 'DP-Check'
dependencyCheckPublisher pattern: '**/dependency-check-report.xml'
}
}
stage('TRIVY FS SCAN') {
steps {
sh "trivy fs . > trivyfs.txt"
}
}
}
post {
always {
emailext attachLog: true,
subject: "'${currentBuild.result}'",
body: "Project: ${env.JOB_NAME}<br/>" +
"Build Number: ${env.BUILD_NUMBER}<br/>" +
"URL: ${env.BUILD_URL}<br/>",
to: 'satyam19arya@gmail.com',
attachmentsPattern: 'trivyfs.txt,trivyimage.txt'
}
}
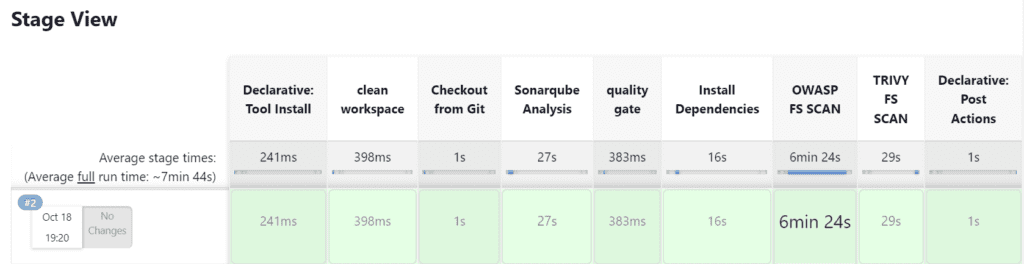
}The stage view would look like this
Step 21:
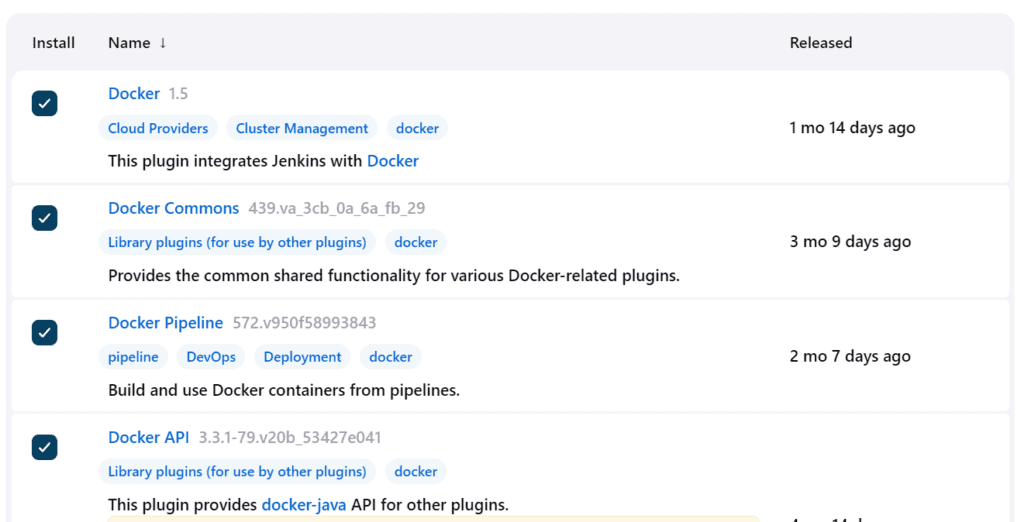
Docker Image Build and Push
Install Plugins -> Docker, Docker Commons, Docker Pipeline, Docker API, docker-build-step
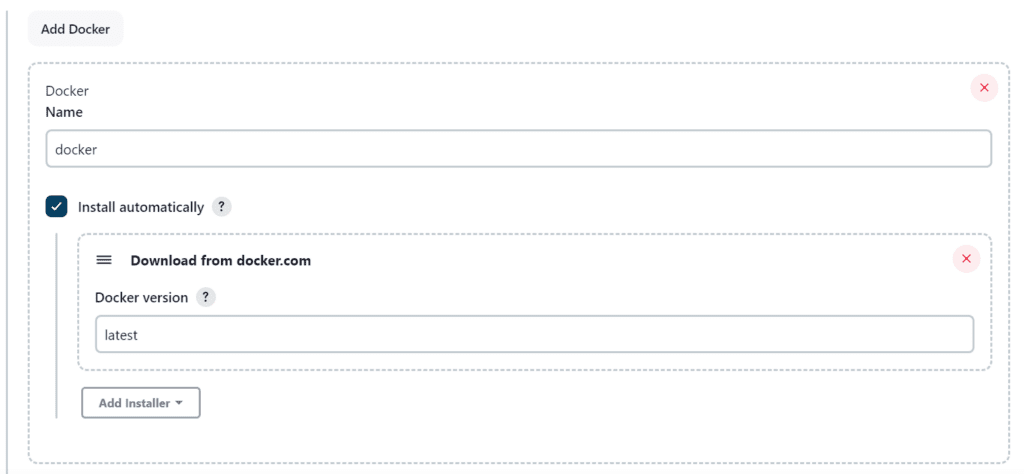
Now, goto Dashboard → Manage Jenkins → Tools
Add DockerHub Username and Password under Global Credentials
Add this stage to Pipeline Script
stage("Docker Build & Push"){
            steps{
                script{
                   withDockerRegistry(credentialsId: 'docker', toolName: 'docker'){
                       sh "docker build --build-arg TMDB_V3_API_KEY=Aj7ay86fe14eca3e76869b92 -t netflix ."
                       sh "docker tag netflix satyam19arya/netflix:latest "
                       sh "docker push satyam19arya/netflix:latest "
                    }
                }
            }
        }
        stage("TRIVY"){
            steps{
                sh "trivy image satyam19arya/netflix:latest > trivyimage.txt"
            }
        }
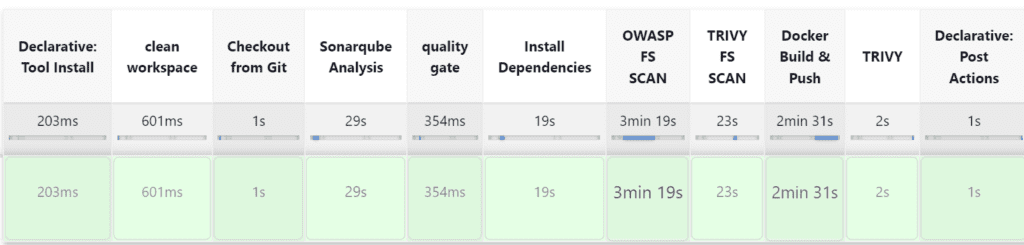
The stage view would look like this
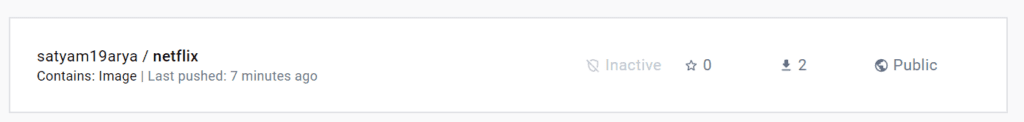
When you log in to DockerHub, you will see a new image is created
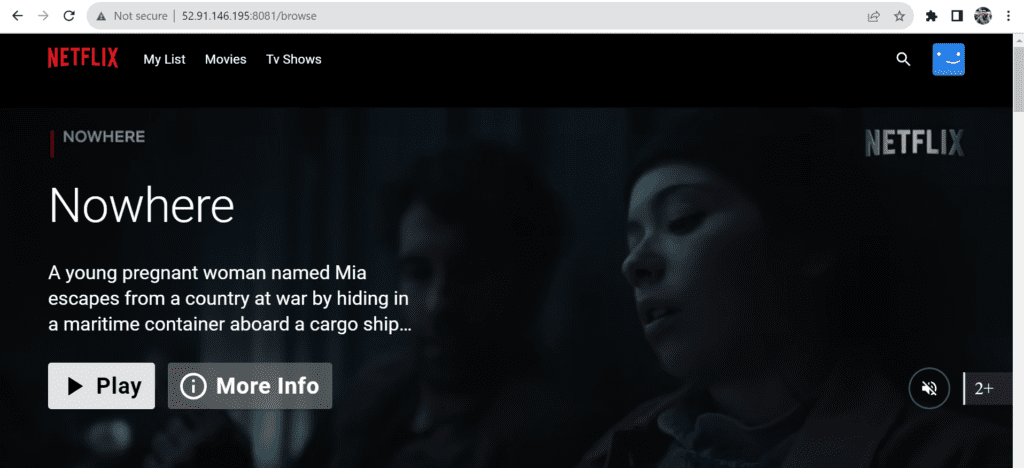
Add one more stage to run the container
stage('Deploy to container'){
            steps{
                sh 'docker run -d --name netflix -p 8081:80 satyam19arya/netflix:latest'
            }
        }
The stage view would look like this
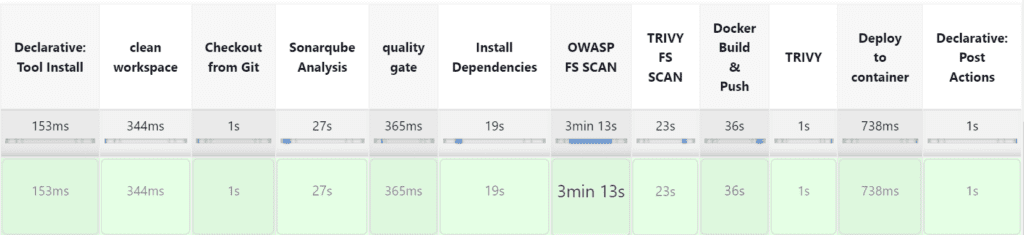
Output